

The Bitcoin price failed to stay above $68,000 and fell sharply. BTC is now consolidating losses and could struggle to recover above $66,000.
- Bitcoin started a new decline and traded below the $66,500 support.
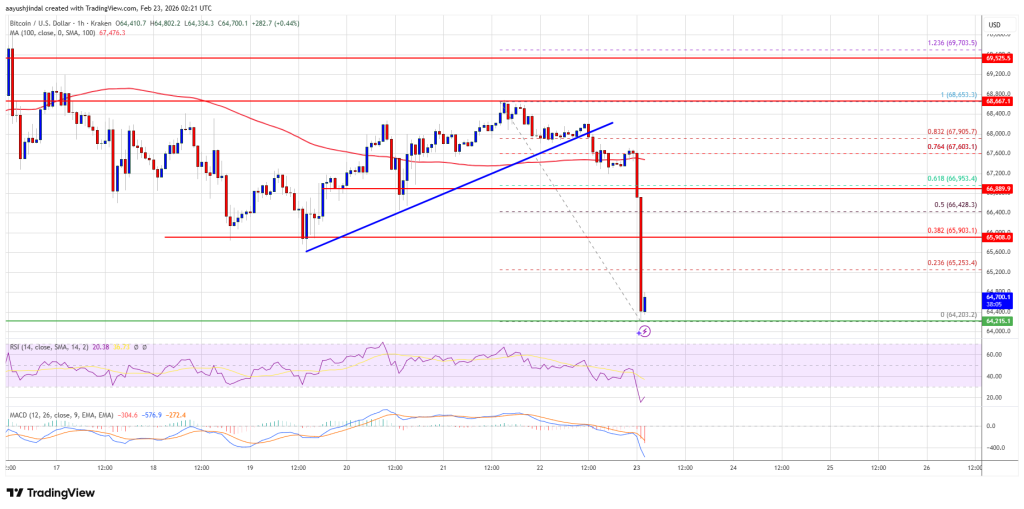
- The price is trading below $66,500 and the 100 hourly moving average.
- There was a break below a bullish trendline with support at $68,000 on the hourly chart of the BTC/USD pair (data feed from Kraken).
- The pair could fall again if it trades below the $64,500 and $64,200 levels.
Bitcoin Price Plunges More Than 5%
Bitcoin price failed to hold steady above the $67,200 zone. BTC started a new decline and traded below the USD 66,500 support zone. There was a drop below $66,000.
The price even peaked below $65,000. There was also a break below a bullish trendline with support at $68,000 on the hourly chart of the BTC/USD pair. A low was formed at $64,203, and the price is now correcting some losses. There was a move above $64,500, but the price is still well below the 23.6% Fib retracement level of the recent decline from the $68,653 swing high to the $64,203 low.
Bitcoin is now trading below $66,500 and the 100 hourly moving average. If the price holds steady above $64,200, another move up could be attempted. The immediate resistance is near the $65,250 level.
The first major resistance is near the $66,400 level or the 50% Fib retracement level of the recent decline from the $68,653 swing high to the $64,203 low. A close above the resistance at $66,400 could send the price higher. In the mentioned case, the price could rise and test the USD 67,000 resistance. Any further gains could send the price towards the USD 67,600 level. The next barrier for the bulls could be $68,000 and $68,500.
Another drop in BTC?
If Bitcoin fails to rise above the USD 66,000 resistance zone, it could trigger another decline. Immediate support is near the $64,400 level. The first major support is near the $64,200 level.
The next support is now near the $63,500 zone. Any further losses could send the price towards the USD 62,850 support in the near term. The key support now lies at $62,000, below which BTC could struggle to recover in the near term.
Technical indicators:
Hourly MACD – The MACD is now gaining speed in the bearish zone.
Hourly RSI (Relative Strength Index) – The RSI for BTC/USD is now below the 50 level.
Major support levels – USD 64,500, followed by USD 64,200.
Major resistance levels – $66,000 and $66,500.