

Bitcoin price is struggling to break above $112,500 and $113,000. BTC is now heading lower and could start a new decline below $108,000.
- Bitcoin started a new decline after failing to break the $113,000 resistance level.
- The price is trading below $110,000 and the 100 hourly Simple Moving Average.
- A bearish trendline is forming with resistance at $110,500 on the hourly chart of the BTC/USD pair (data feed from Kraken).
- The pair could continue to decline if it trades below the $107,500 zone.
Bitcoin price drops again
Bitcoin price failed to surpass the USD 113,000 resistance level and started a new decline. BTC fell below the USD 112,000 and USD 110,500 support levels and entered a bearish zone.
The price even dropped below $108,000. A low was formed at $107,483 and the price is now consolidating losses below the 23.6% Fib retracement level from the recent decline from the swing high of $115,975 to the low of $107,483.
Bitcoin is now trading below $110,000 and the 100 hourly Simple Moving Average. Moreover, a bearish trendline is forming with resistance at $110,500 on the hourly chart of the BTC/USD pair. The immediate resistance on the upside is near the $109,500 level.
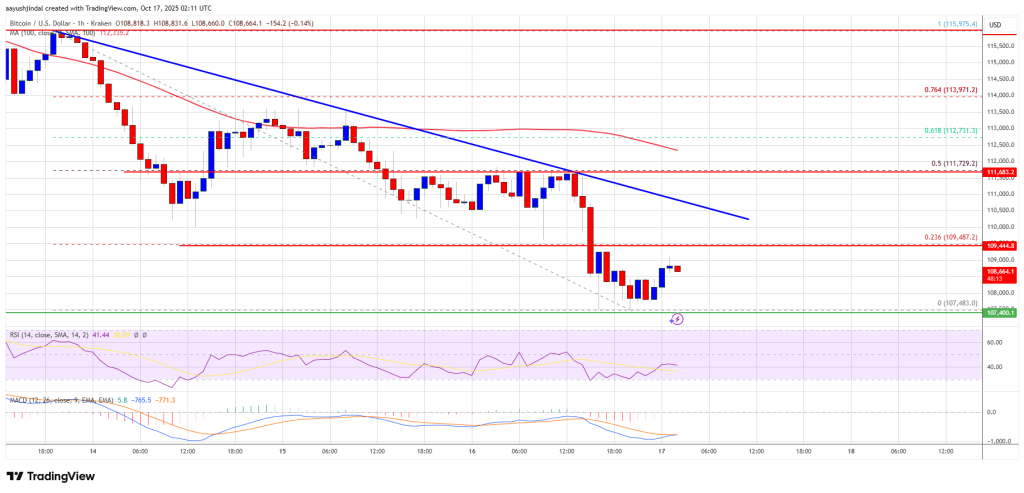
The first major resistance is around the $110,000 level. The next resistance could be $110,500 and the trendline. A close above the resistance at $110,500 could send the price higher. In the mentioned case, the price could rise and test the resistance at $111,800 as it is close to the 50% Fib retracement level of the recent decline from the $115,975 swing high to the $107,483 low. Any further gains could send the price towards the USD 112,500 level. The next threshold for the bulls could be $113,000.
Another drop in BTC?
If Bitcoin fails to rise above the $110,000 resistance zone, it could start a new decline. Immediate support is approaching the $108,000 level. The first major support is near the $107,500 level.
The next support is now near the $106,200 zone. Any further losses could send the price towards the USD 105,500 support in the near term. The key support is at $103,200, below which BTC could struggle to recover in the near term.
Technical indicators:
Hourly MACD – The MACD is now gaining speed in the bearish zone.
Hourly RSI (Relative Strength Index) – The RSI for BTC/USD is now below the 50 level.
Major support levels – $108,000, followed by $107,500.
Major resistance levels – $110,000 and $110,500.