
Bitcoin price started a new rise above $95,500. BTC is trading above $96,000 and could soon aim for a move towards $100,000 in the near term.
- Bitcoin started a decent rise above $94,000 and $95,500.
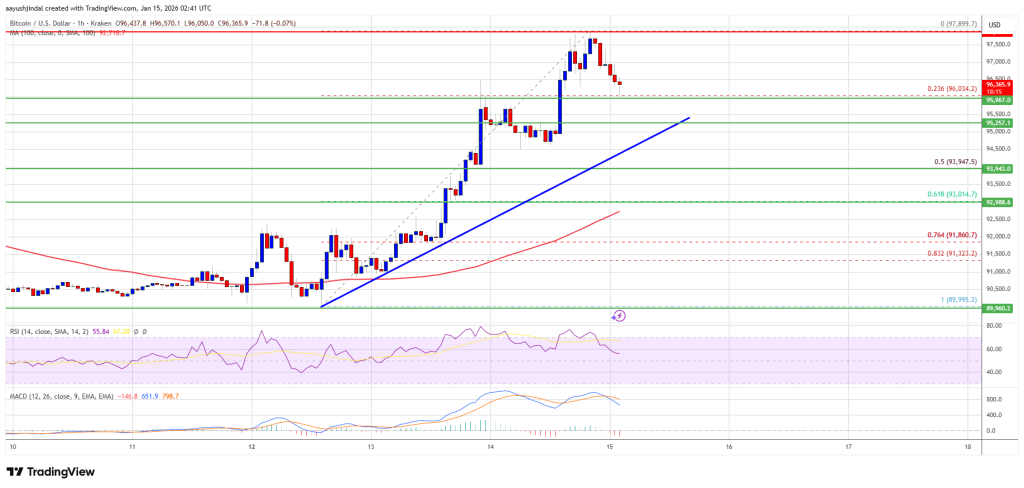
- The price is trading above $95,000 and the 100 hourly Simple Moving Average.
- A bullish trendline is forming with support at $95,250 on the hourly chart of the BTC/USD pair (data feed from Kraken).
- The pair could continue to rise if it remains above the $95,000 zone.
Bitcoin price breaks through major resistance
Bitcoin price managed to stay above the USD 92,500 support and started a new increase. BTC was able to settle above $94,000 and $95,000.
The bulls managed to push the price above $95,500. Ultimately, the price peaked above $97,000. A high was reached at $97,898, and the price is now consolidating gains above the 23.6% Fib retracement level of the recent wave from the swing low of $89,995 to the high of $97,898.
Bitcoin is now trading above $96,000 and the 100 hourly Simple Moving Average. If the price remains stable above $95,500, another increase could be attempted. The immediate resistance is near the $97,200 level. The first major resistance is near the $97,800 level.
The next resistance could be $98,000. A close above the USD 98,000 resistance could send the price higher. In the mentioned case, the price could rise and test the USD 98,800 resistance. Any further gains could send the price towards the USD 99,500 level. The next barrier for the bulls could be $99,800 and $100,000.
Another drop in BTC?
If Bitcoin fails to rise above the USD 97,200 resistance zone, it could trigger another decline. Immediate support is near the $96,000 level. The first major support is near the $95,250 level and trendline.
The next support now lies near the $94,000 zone or the 50% Fib retracement level of the recent wave from the $89,995 swing low to the $97,898 high. Any further losses could send the price towards the USD 93,000 support in the short term. The key support is at $92,500, below which BTC could potentially accelerate lower in the near term.
Technical indicators:
Hourly MACD – The MACD is now losing pace in the bullish zone.
Hourly RSI (Relative Strength Index) – The RSI for BTC/USD is now above the 50 level.
Major support levels – USD 96,000, followed by USD 95,250.
Major resistance levels – $97,200 and $97,800.