

Bitcoin price is consolidating above the USD 26,000 support. BTC could start a recovery wave if it manages to break the USD 26,500 resistance zone in the short term.
- Bitcoin is still consolidating above the USD 26,000 support zone.
- The price is trading below $26,400 and the 100 hourly Simple Moving Average.
- A major bearish trendline is forming with resistance around $26,300 on the hourly chart of the BTC/USD pair (data feed from Kraken).
- The pair could start a significant recovery wave unless there is a significant move below $26,000.
Bitcoin Price Eyes recovery
Bitcoin price held steady above the USD 26,000 support zone. BTC appears to be forming a support base above the $26,000 level in the short term and is currently consolidating.
Recently, the price made a recovery wave attempt above the USD 26,200 level. However, the bears remained active below the USD 26,500 level. They rejected the 50% Fib retracement level of the downward move from the $26,712 swing high to the $26,026 low.
Bitcoin is now trading below $26,400 and the 100 hourly Simple Moving Average. The immediate resistance on the upside is near the $26,300 level. There is also a major bearish trendline forming with resistance around $26,300 on the hourly chart of the BTC/USD pair.
The next major resistance could be near the $26,350 level or the 100 Hourly Simple Moving Average, above which the price will break the $26,500 resistance or the 76.4% Fib retracement level of the downward move from the $26,712 swing high to the $26,026 low could revise.
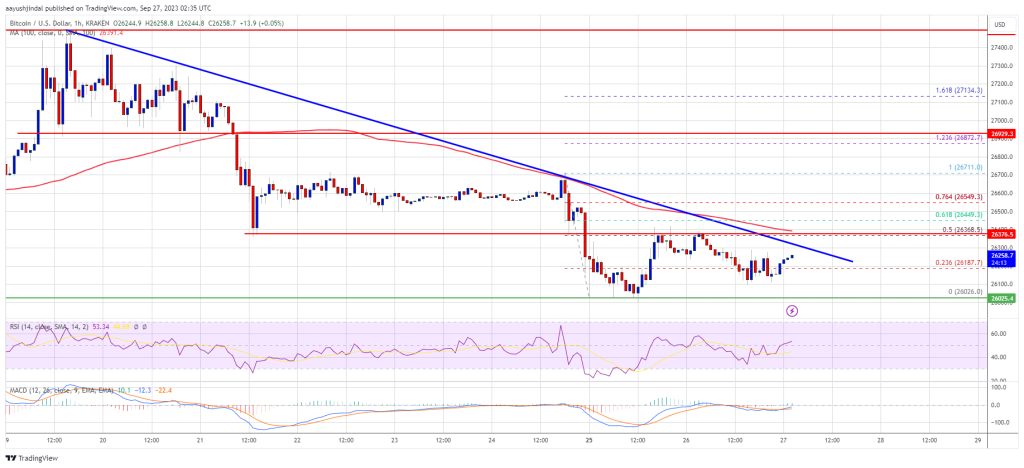
Source: BTCUSD on TradingView.com
To trigger a recovery wave, the price needs to break above $26,500. In the mentioned case, the price could rise towards the USD 27,000 resistance. Further gains could require a move towards the $27,500 level.
Lose more in BTC?
If Bitcoin fails to spark a fresh rise above the $26,300 resistance, it could continue to decline. The immediate downside support is near the USD 26,050 level.
The next major support is near the USD 26,000 level. A downside break and a close below the $26,000 level could trigger another big decline. The next support is at $25,400. Further losses could require a $25,000 test.
Technical indicators:
Hourly MACD – The MACD is now losing pace in the bearish zone.
Hourly RSI (Relative Strength Index) – The RSI for BTC/USD is now approaching the 50 level.
Major support levels – USD 26,050, followed by USD 26,000.
Major resistance levels – $26,300, $26,500 and $27,000.