

Bitcoin price recovered and tested the USD 63,650 resistance zone. BTC is now consolidating gains and could make another attempt to surpass $63,650.
- Bitcoin started a decent rise above the USD 62,500 and USD 63,000 levels.
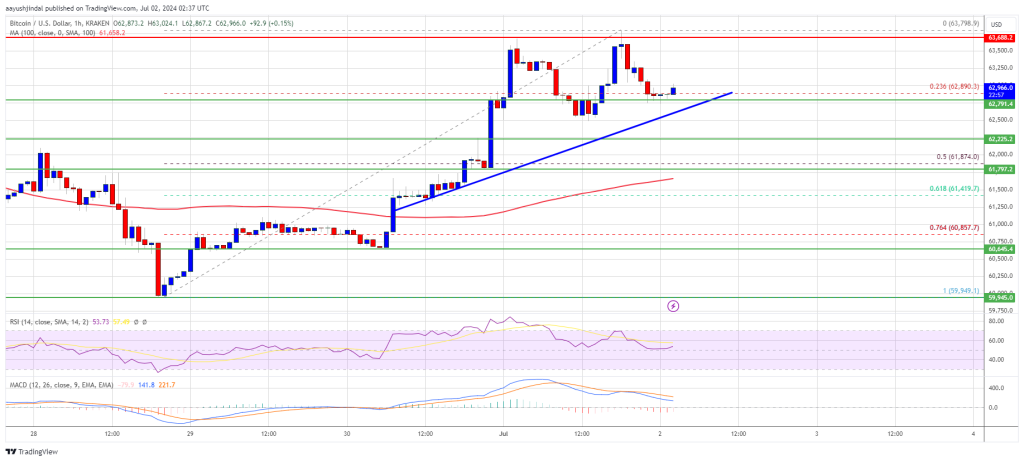
- The price is trading above USD 62,250 and the 100 hourly Simple Moving Average.
- A connecting bullish trendline is forming with support at $62,800 on the hourly chart of the BTC/USD pair (data feed from Kraken).
- The pair could gain bullish momentum if it breaks the $63,650 resistance zone.
Bitcoin price holds steady
Bitcoin price started a decent upward move above the $61,200 zone. BTC was able to break the USD 62,000 and USD 63,000 resistance levels and move into a positive short-term zone.
However, the bears took a stand near the $63,650 zone. It peaked at $63,798 and the price recently corrected some gains. There was a move below the USD 63,200 level. The price tested the 23.6% Fib retracement level of the upward move from the $59,950 swing low to the $63,798 high.
Bitcoin price is now trading above $62,250 and the 100 hourly Simple Moving Average. A connecting bullish trendline is also forming with support at $62,800 on the hourly chart of the BTC/USD pair.
If another rise occurs, the price may encounter resistance near the USD 63,250 level. The first major resistance is around the $63,650 level. The next major resistance could be at USD 64,000. A clear move above the USD 64,000 resistance could trigger a steady rise and send the price higher.
In the mentioned case, the price could rise and test the USD 65,000 resistance. Any further gains could send BTC towards the USD 66,500 resistance in the short term.
Are dips supported in BTC?
If Bitcoin fails to climb above the USD 63,650 resistance zone, it could slowly move lower. The immediate downside support is near the $62,800 level and the trendline.
The first major support is at $62,200. The next support is now forming near $61,800 and the 100 hourly Simple Moving Average. It is close to the 50% Fib retracement level of the upward move from the $59,950 swing low to the $63,798 high. Any further losses could send the price towards the $60,500 support zone in the near term.
Technical indicators:
Hourly MACD – The MACD is now losing pace in the bullish zone.
Hourly RSI (Relative Strength Index) – The RSI for BTC/USD is now above the 50 level.
Major support levels – USD 62,800, followed by USD 61,800.
Major resistance levels – $63,650 and $64,000.