

Bitcoin price cut all gains and tested the USD 25,650 zone. BTC is now at risk of another decline towards the USD 24,500 level in the near term.
- Bitcoin started a fresh decline below the USD 26,500 and USD 26,200 levels.
- The price is trading below $26,600 and the 100 hourly Simple Moving Average.
- A major bearish trendline is forming with resistance near $26,750 on the hourly chart of the BTC/USD pair (data feed from Kraken).
- The pair could extend its decline towards $24,500 in the coming sessions.
Bitcoin price starts falling again
Bitcoin price failed to climb above the USD 27,000 resistance zone again. BTC started a fresh decline and gained bearish momentum below the USD 26,500 level.
There was a clear move below the USD 26,200 level. The price even peaked below the USD 26,000 level. A low is forming near USD 25,663 and the price is now consolidating losses. Bitcoin is now trading below $26,600 and the 100 Hourly Simple Moving Average.
In addition, a major bearish trendline with resistance is forming around $26,750 on the hourly chart of the BTC/USD pair. The immediate resistance on the upside is near the USD 26,250 level. It is close to the 23.6% Fib retracement level of the recent drop from the $28,150 swing high to the $25,663 low.
The first major resistance is near the USD 26,650 level or trendline area. The trendline is also close to the 50% Fib retracement level from the recent drop from the $28,150 swing high to the $25,663 low. The main resistance is now forming around the USD 27,000 level.
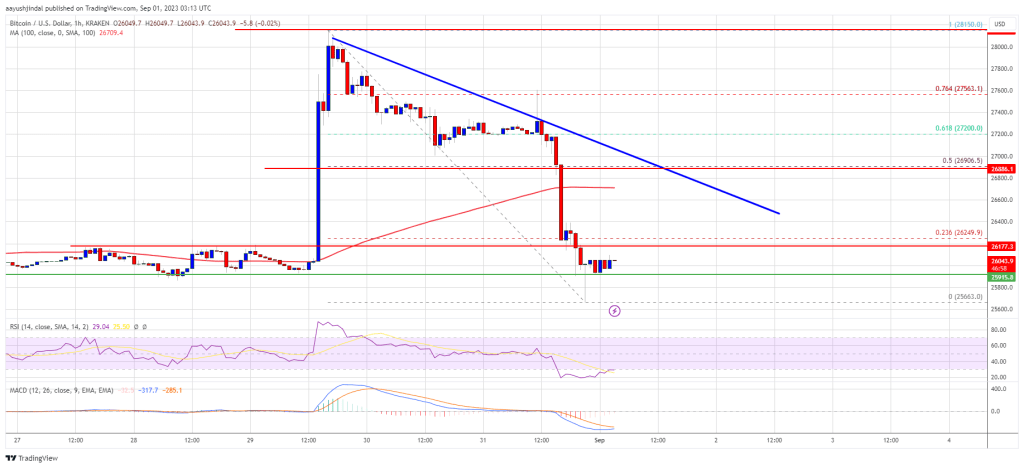
Source: BTCUSD at TradingView.com
A clear move above the USD 27,000 level could push the price towards USD 27,400. The next major resistance is near USD 28,000, above which there could be a sustained increase. In the case mentioned, the price could test the USD 29,200 level.
Lose more in BTC?
If Bitcoin fails to clear the USD 26,750 resistance, it could continue to decline. The immediate downside support is near the USD 25,800 level.
The next major support is near the USD 25,650 level. A downside break below the USD 25,650 level could put a lot of pressure on the bulls. In the said case, the price could fall towards USD 24,500.
Technical indicators:
Hourly MACD – The MACD is now losing pace in the bearish zone.
Hourly RSI (Relative Strength Index) – The RSI for BTC/USD is now below the 50 level.
Key Support Levels – $25,800, followed by $25,650.
Key resistance levels – $26,250, $26,750 and $27,000.