

Bitcoin price corrected gains and traded below the $125,000 pivot level. BTC is now consolidating near $122,200 and could struggle to break above $125,000.
- Bitcoin started a downward correction below the $124,000 level.
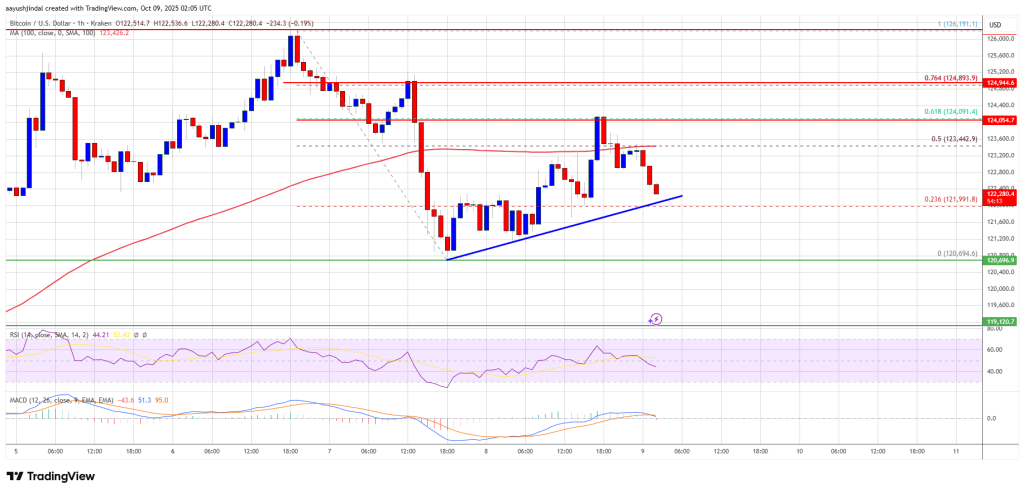
- The price is trading below $123,500 and the 100 hourly Simple Moving Average.
- A bullish trendline is forming with support at $122,200 on the hourly chart of the BTC/USD pair (data feed from Kraken).
- The pair could continue to decline if it trades below the $122,000 zone.
Bitcoin price drops again
Bitcoin price extended gains above the $125,000 zone. BTC climbed above the $125,250 and $125,500 resistance levels before the bears appeared.
A new high was reached at $126,198 before a correction occurred. The price dipped below the USD 123,000 support zone and tested the USD 120,500 region. A low was formed at $120,694 and the price recently recovered above the 50% Fib retracement level from the recent decline from the $126,191 swing high to the $120,694 low.
However, the bears are still active around $124,000. Bitcoin is now trading below $123,500 and the 100 hourly Simple Moving Average. Moreover, a bullish trendline is forming with support at $122,200 on the hourly chart of the BTC/USD pair.
The immediate resistance on the upside is near the $123,450 level. The first major resistance is near the $124,000 level and the 61.8% Fib retracement level of the recent decline from the $126,191 swing high to the $120,694 low.
The next resistance could be $124,850. A close above the resistance at $124,850 could send the price higher. In the mentioned case, the price could rise and test the USD 125,500 resistance. Any further gains could send the price towards the $126,000 level. The next threshold for the bulls could be $126,200.
Lose more in BTC?
If Bitcoin fails to rise above the USD 124,000 resistance zone, it could start a new decline. Immediate support is approaching the $122,000 level. The first major support is near the $121,200 level.
The next support is now near the $120,500 zone. Any further losses could send the price towards the $118,500 support in the short term. The key support is at $116,800, below which BTC could struggle to recover in the near term.
Technical indicators:
Hourly MACD – The MACD is now losing pace in the bullish zone.
Hourly RSI (Relative Strength Index) – The RSI for BTC/USD is now below the 50 level.
Major support levels – USD 122,000, followed by USD 121,200.
Major resistance levels – $124.00 and $124.850.