

- Bitcoin’s Binary CDD and HODL Waves indicated that long-term holders were piling in, easing market pressure on the sell side.
- New triggers could drive the next big price move.
Bitcoins [BTC] On-chain metrics paint a compelling picture of reduced sell-side pressure, with long-term holders (LTHs) showing signs of accumulation rather than distribution.
Key indicators such as Binary Coin Days Destroyed (CDD), HODL Waves and Exchange Netflow show a stabilizing market, but new catalysts may be needed to unlock the next phase of growth.
LTHs take a backseat
The Bitcoin binary CDD The indicator, which measures the intensity of currency movement by long-term holders, has recently shown values consistently below 0.3.
This suggests that LTHs are not actively issuing or selling their coins, a trend that is often accompanied by reduced pressure on the sell side.

Source: Glassnode
Historically, periods of low binary CDD have preceded bullish phases, as long-term holders tend to hold on to their coins during market uncertainty.
With Bitcoin’s price hovering around $102,000, this metric indicates that LTHs are likely waiting for stronger signals before making significant moves.
A growing preference for accumulation
The Realized Cap HODL Waves chart of Glass junction further proves this trend.
The data shows that a significant portion of Bitcoin’s supply is in the hands of long-term holders, with 1-2 year and 2-3 year coins seeing notable increases.
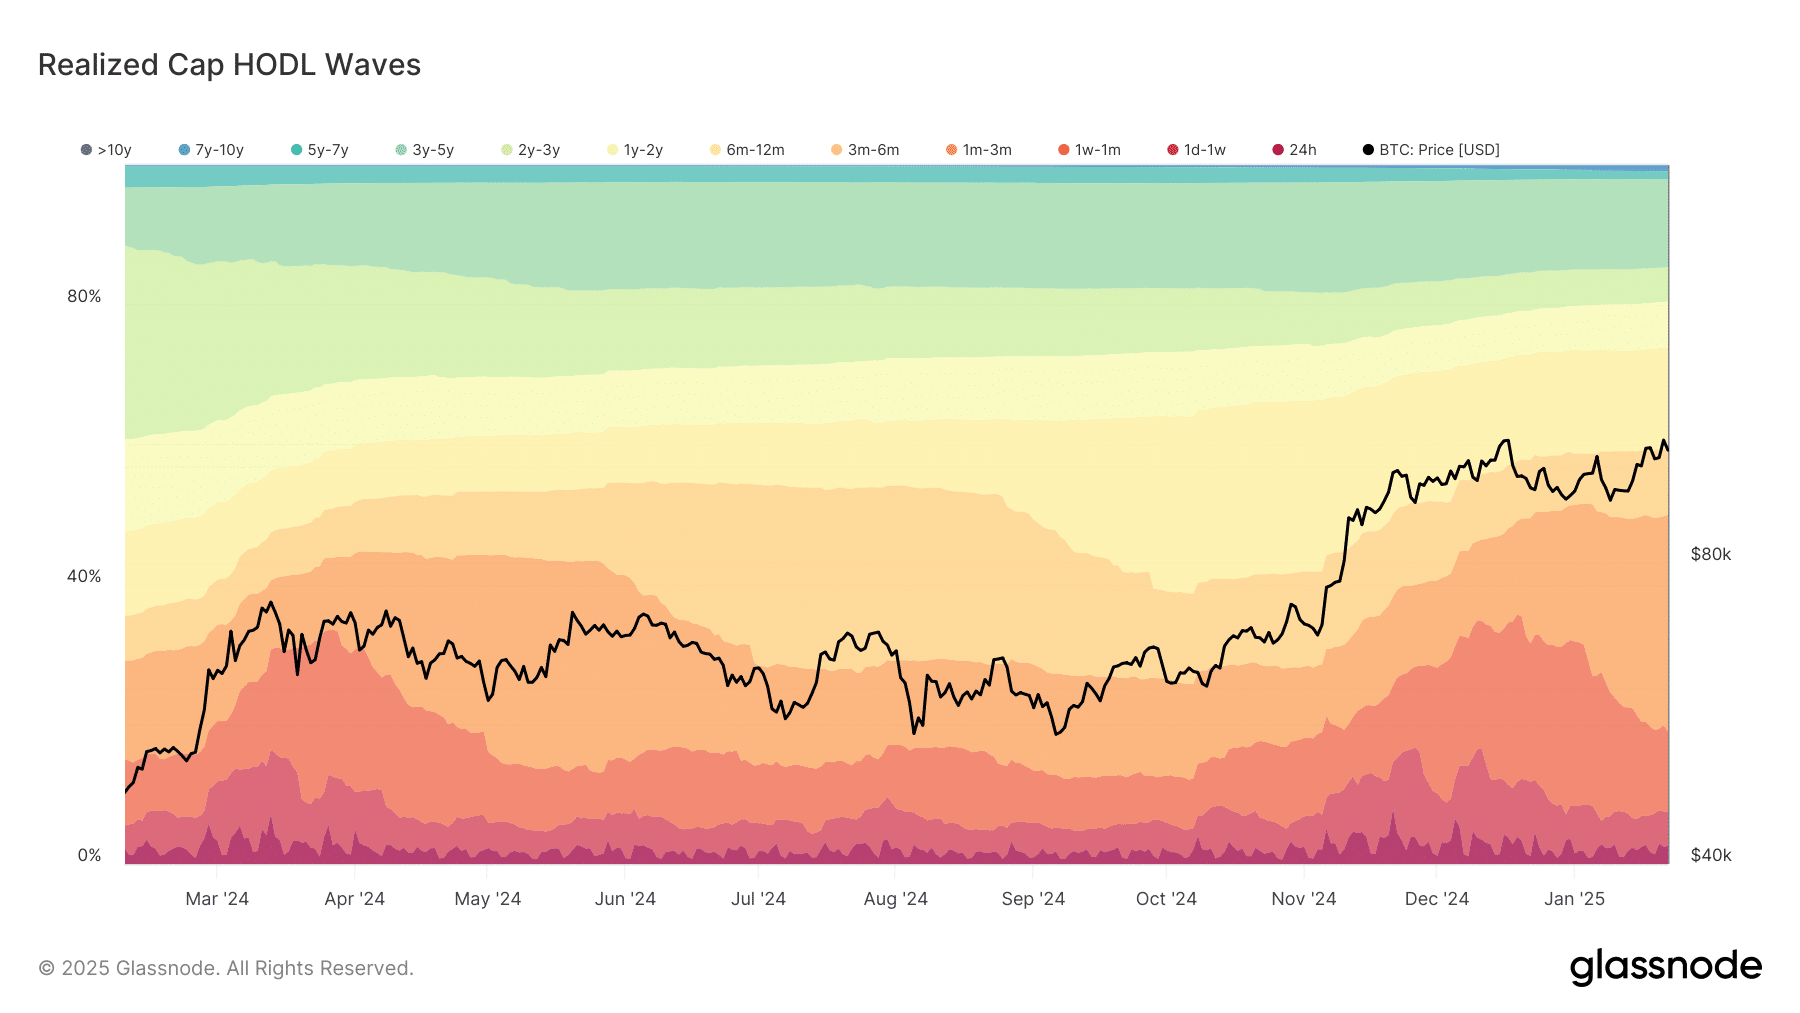
Source: Glassnode
The number of coins held for one to two years has grown steadily, indicating that investors who bought during the 2022 bear market are holding strong.
Similarly, the coins kept for 2 to 3 years have also expanded. It reflects the confidence among those built up during the 2020-2021 bull run.
These HODL waves suggest that long-term holders are not only refraining from selling but also accumulating more Bitcoin, further reducing the available supply in the market.
Bitcoin shows a negative current
The Bitcoin Exchange Netflow metric, which tracks the movement of coins to and from exchanges, has shown a consistent negative trend in recent months.
This means that more Bitcoin is withdrawn from the exchanges than is deposited. This trend is a strong indicator of accumulation.
Recent data shows that net flows have been largely negative, with outflows peaking during key price movements. At the time of writing, the net flow was negative, with over 258 BTC recorded.
For example, during Bitcoin’s recent surge, exchange net flow dropped significantly, indicating that investors have moved their coins to cold storage.

Source: CryptoQuant
A negative net flow reduces direct pressure on the sell side because there are fewer coins available on exchanges to trade. This trend is consistent with the behavior of long-term investors who prefer to hold rather than trade.
What’s next for Bitcoin?
While current on-chain metrics point to a stabilizing market, Bitcoin’s price action may require new catalysts to break through key resistance levels.
The recent chart analysis provides additional insights into Bitcoin’s potential trajectory.

Source: TradingView
The chart shows that the price of Bitcoin is hovering around $102,587.51. It had a daily high of $103,779.99 and a low of $101,512.88.
Read Bitcoin’s [BTC] Price forecast 2025-26
The 50 and 200 day moving averages are 98,599.97 and $75,750.86 respectively, indicating a bullish crossover. This indicates that despite the short-term volatility, the long-term trend is still upward.
Bitcoin’s on-chain metrics show that long-term holders are holding strong and pressure on the sell side is easing. While this lays a foundation for market stability, the next major price move will likely depend on external catalysts.