

Journalist
Posted:
- The stablecoin supply ratio indicated bearish sentiment.
- The Tether Dominance chart can be useful for determining the local top of BTC
Bitcoin [BTC] formed a range after crossing the $50,000 threshold, which was also a psychological resistance level. The bullish momentum had stalled, although the higher timeframe market structure remained bullish.
Tether [USDT] Trading volumes have surged over the past month as altcoin and BTC prices soared higher.
Institutional demand for BTC is likely to continue growing in 2024. Millions of dollars continued to pour in Bitcoin ETFs.
AMBCrypto’s look at some stablecoin metrics and the USDT Dominance chart proved insightful.
The supply ratio of stablecoins is rising again
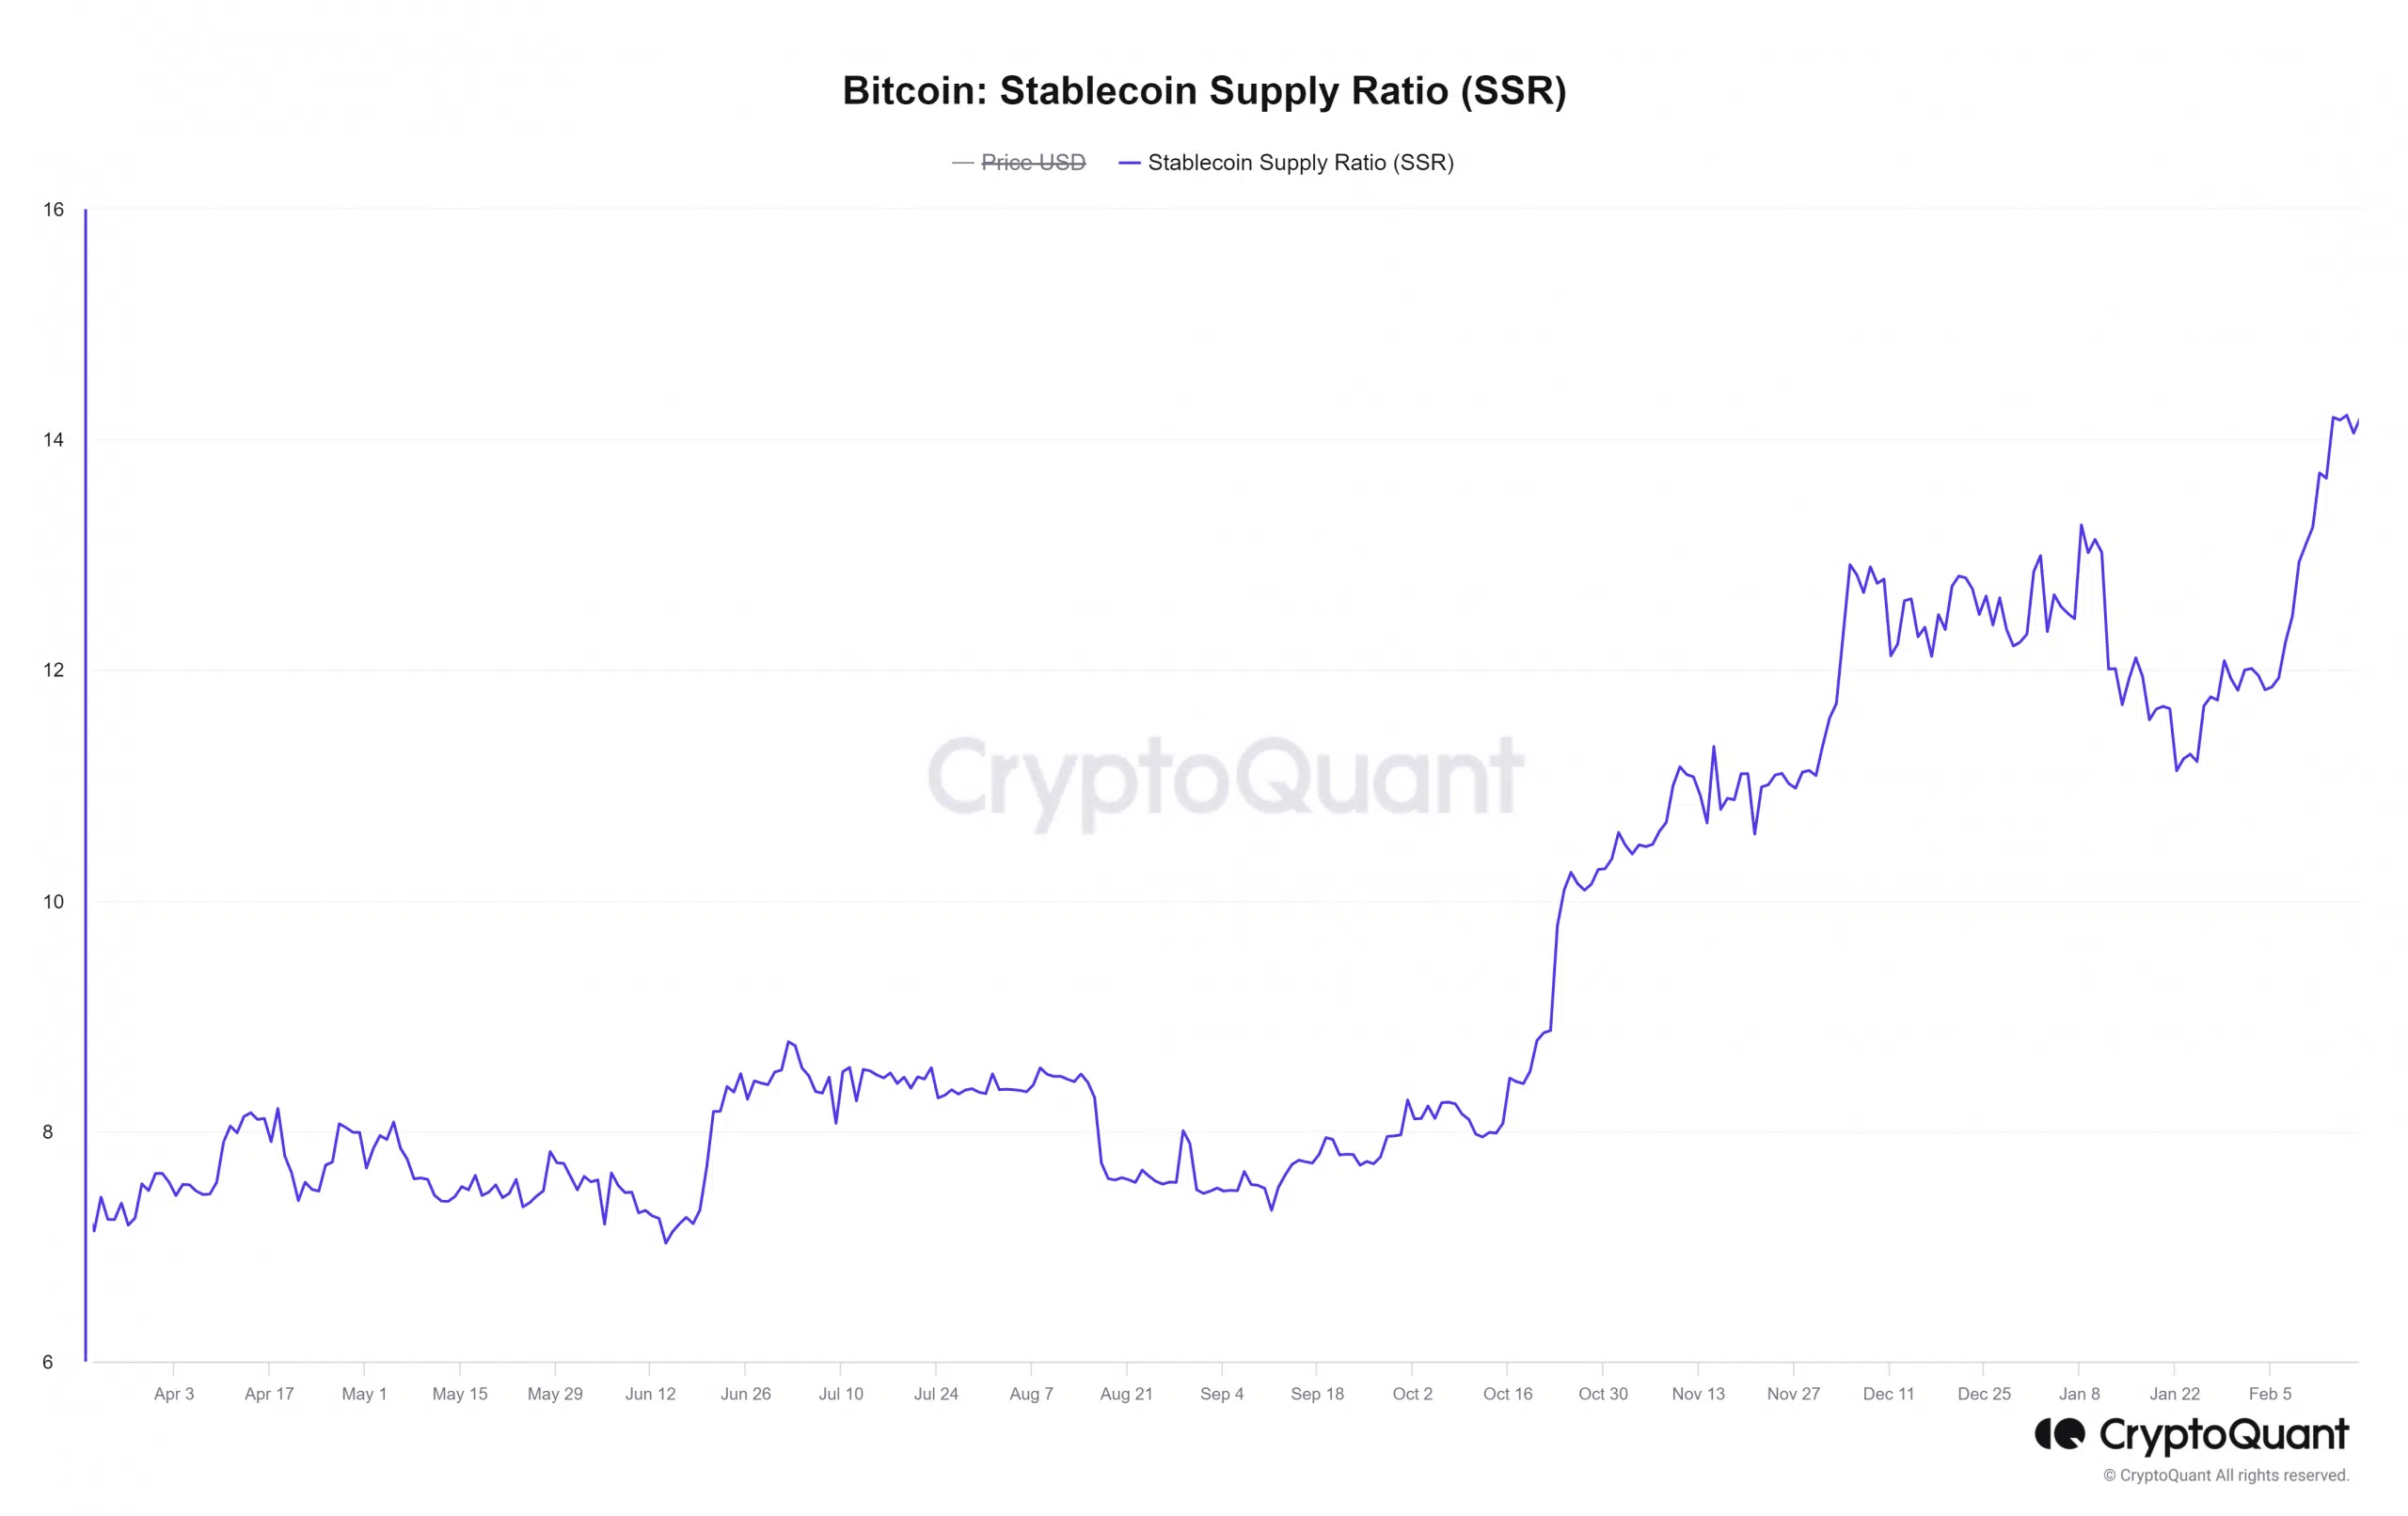
Source: CryptoQuant
Data from CryptoQuant showed that the Stablecoin Supply Ratio (SSR) fell sharply from January 8 to 23. Since then, the price has soared higher than January highs.
The rise of the SSR metric showed that the purchasing power of the stablecoin supply in the press declined against Bitcoin.
Given Bitcoin’s price trajectory over the past month, this was understandable. But the SSR rally also signals possible bearish sentiment – although we don’t see strong evidence of that yet.
Bitcoin’s market cap rose to $1.013 trillion from $755 billion at its January 23 low.
The same applies to the market capitalization of the altcoins, excluding Ethereum [ETH]rose from $439.86 billion to $546.7 billion at the time of writing.
Whether the market would continue to make gains could be better understood by examining stablecoin statistics.
The number of USDT transactions has fallen in 2024
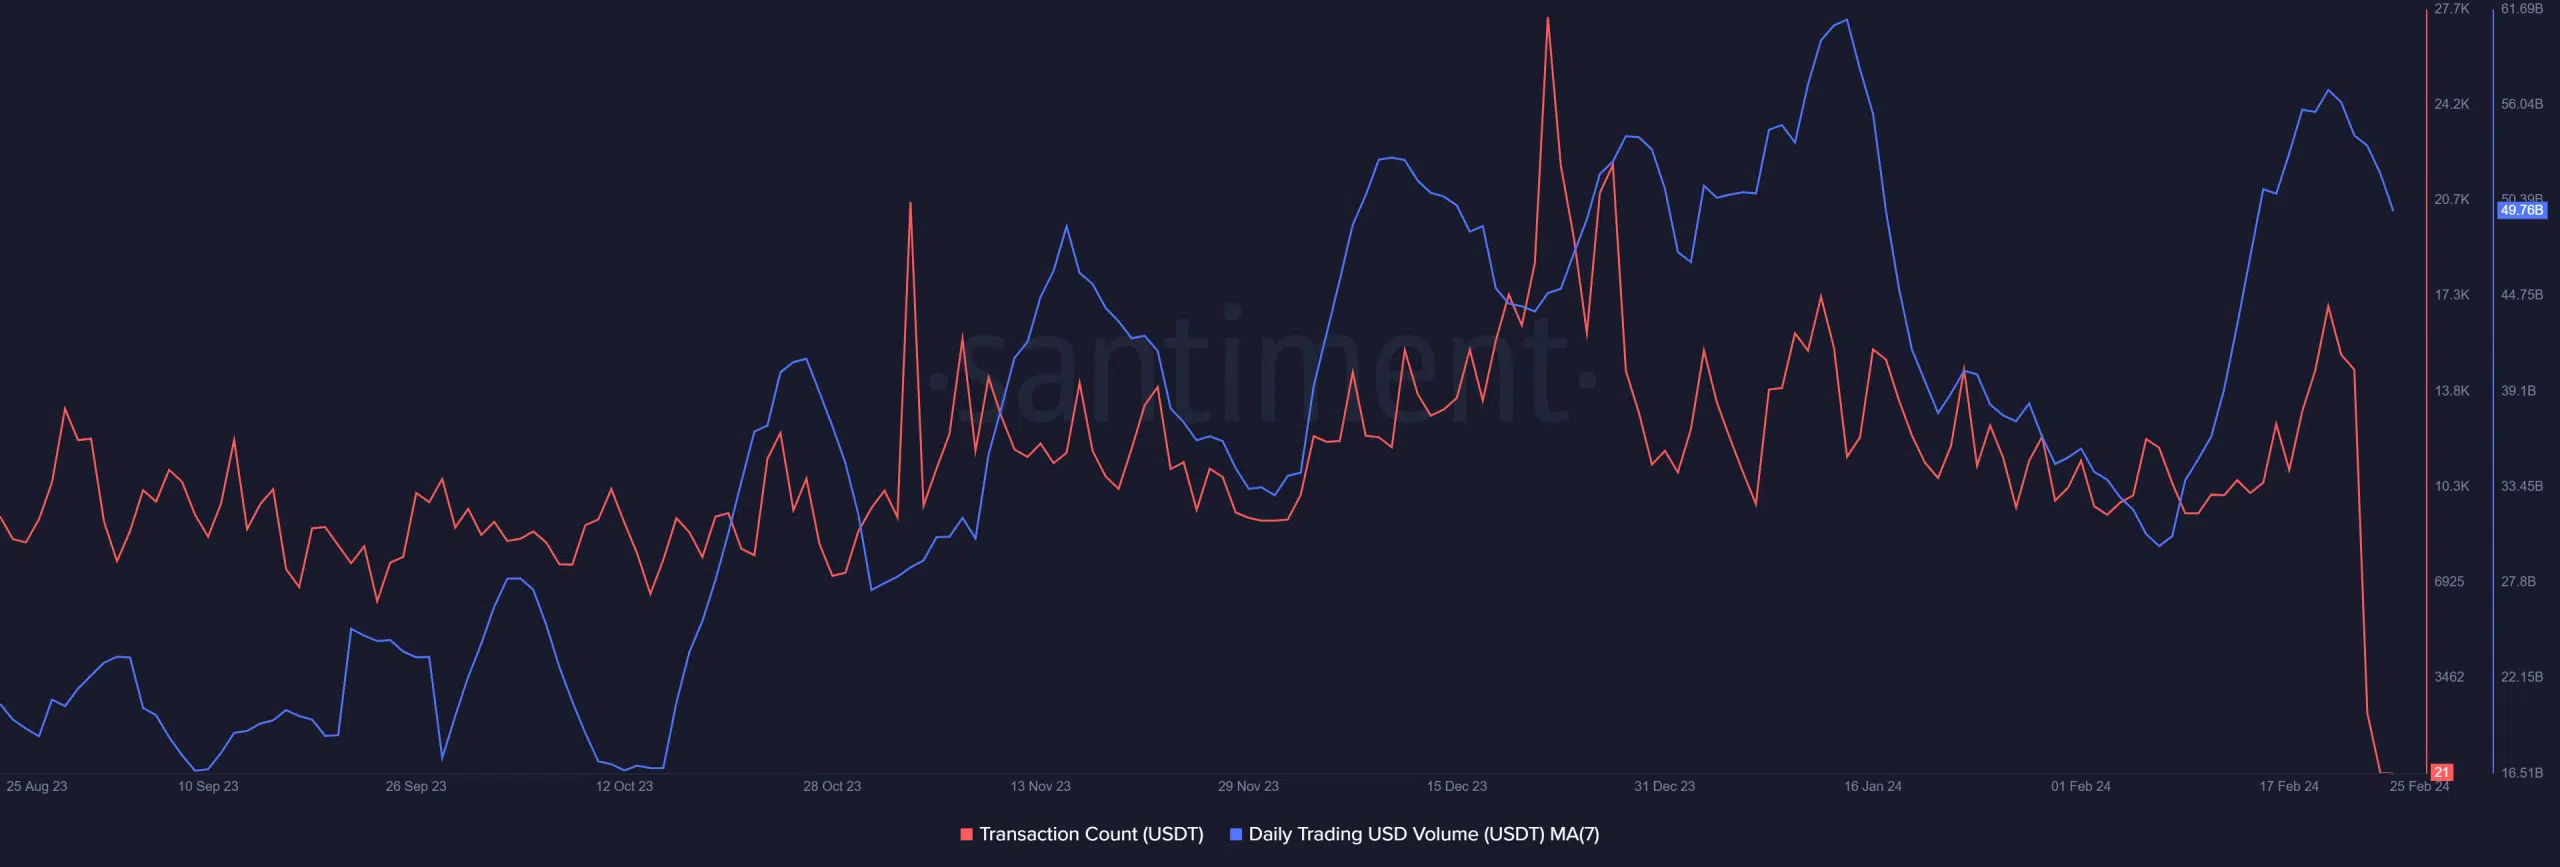
Source: Santiment
AMBCrypto looked at Tether stats on Santiment. Trading volume rebounded sharply in February after a decline in January.
This matched the price increase we saw since January 23, which was also accompanied by an increase in trading volumes.
The number of transactions has been on a downward trend since the second half of December. The price picked up in mid-February, but was still nowhere near the December highs.
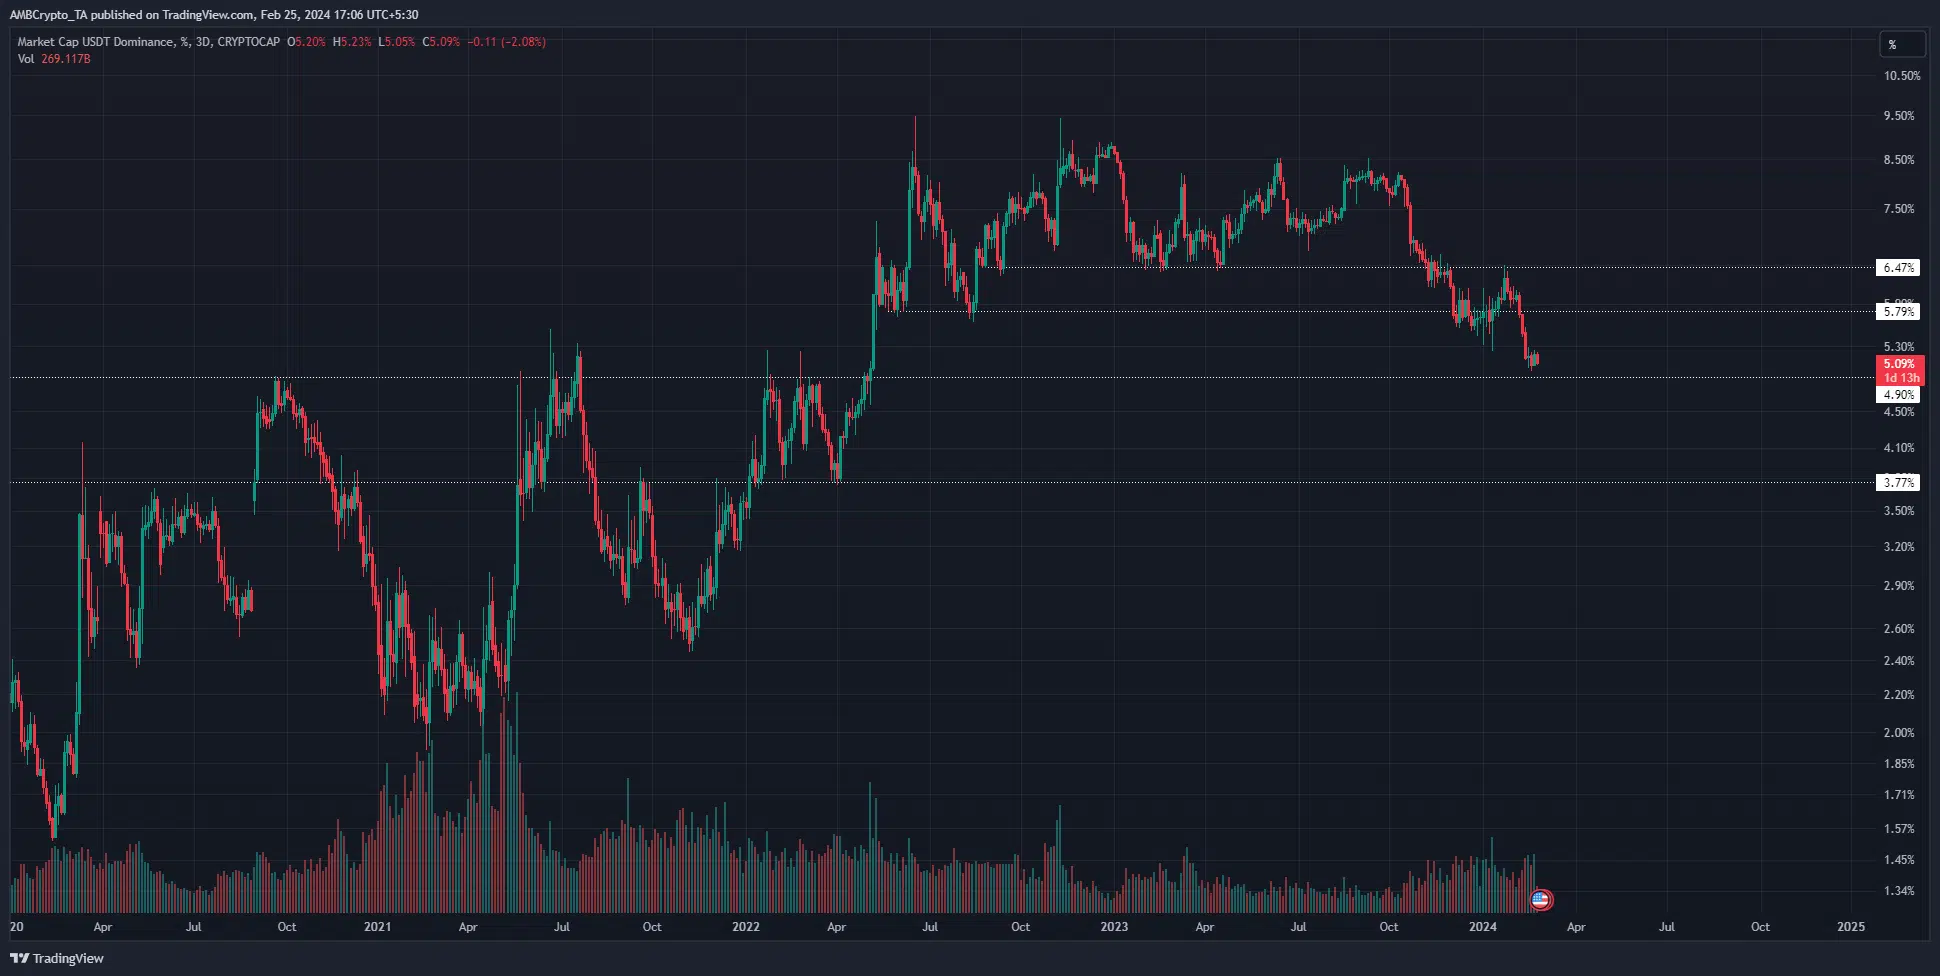
Source: USDT Dominance, TradingView
The USDT Dominance chart is a measure of Tether’s market capitalization, as a percentage of the total crypto market capitalization. TradingView’s D3 chart shows that it has been on a downward trend since early November.
Is your portfolio green? Check out the BTC profit calculator
At the time of writing, dominance stood at 5.09%. Technical analyzes showed that the 4.9% level was strong support.
If the dominance chart moves lower than 4.9%, it would be a strong indication that Bitcoin will recover past the USD 53,000 resistance to reach USD 58,000. The altcoin markets would also follow the price increase.