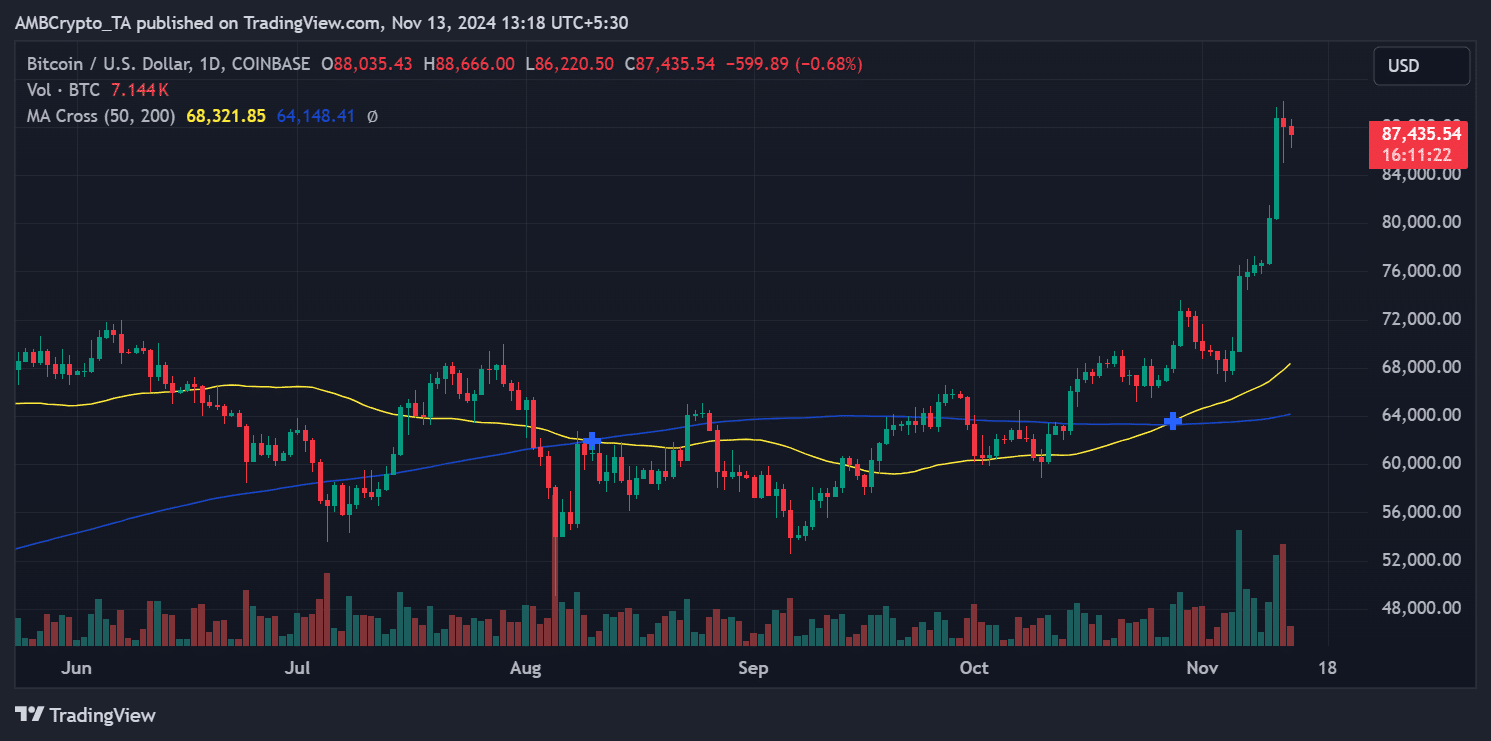
- Bitcoin is currently trading around $87,000.
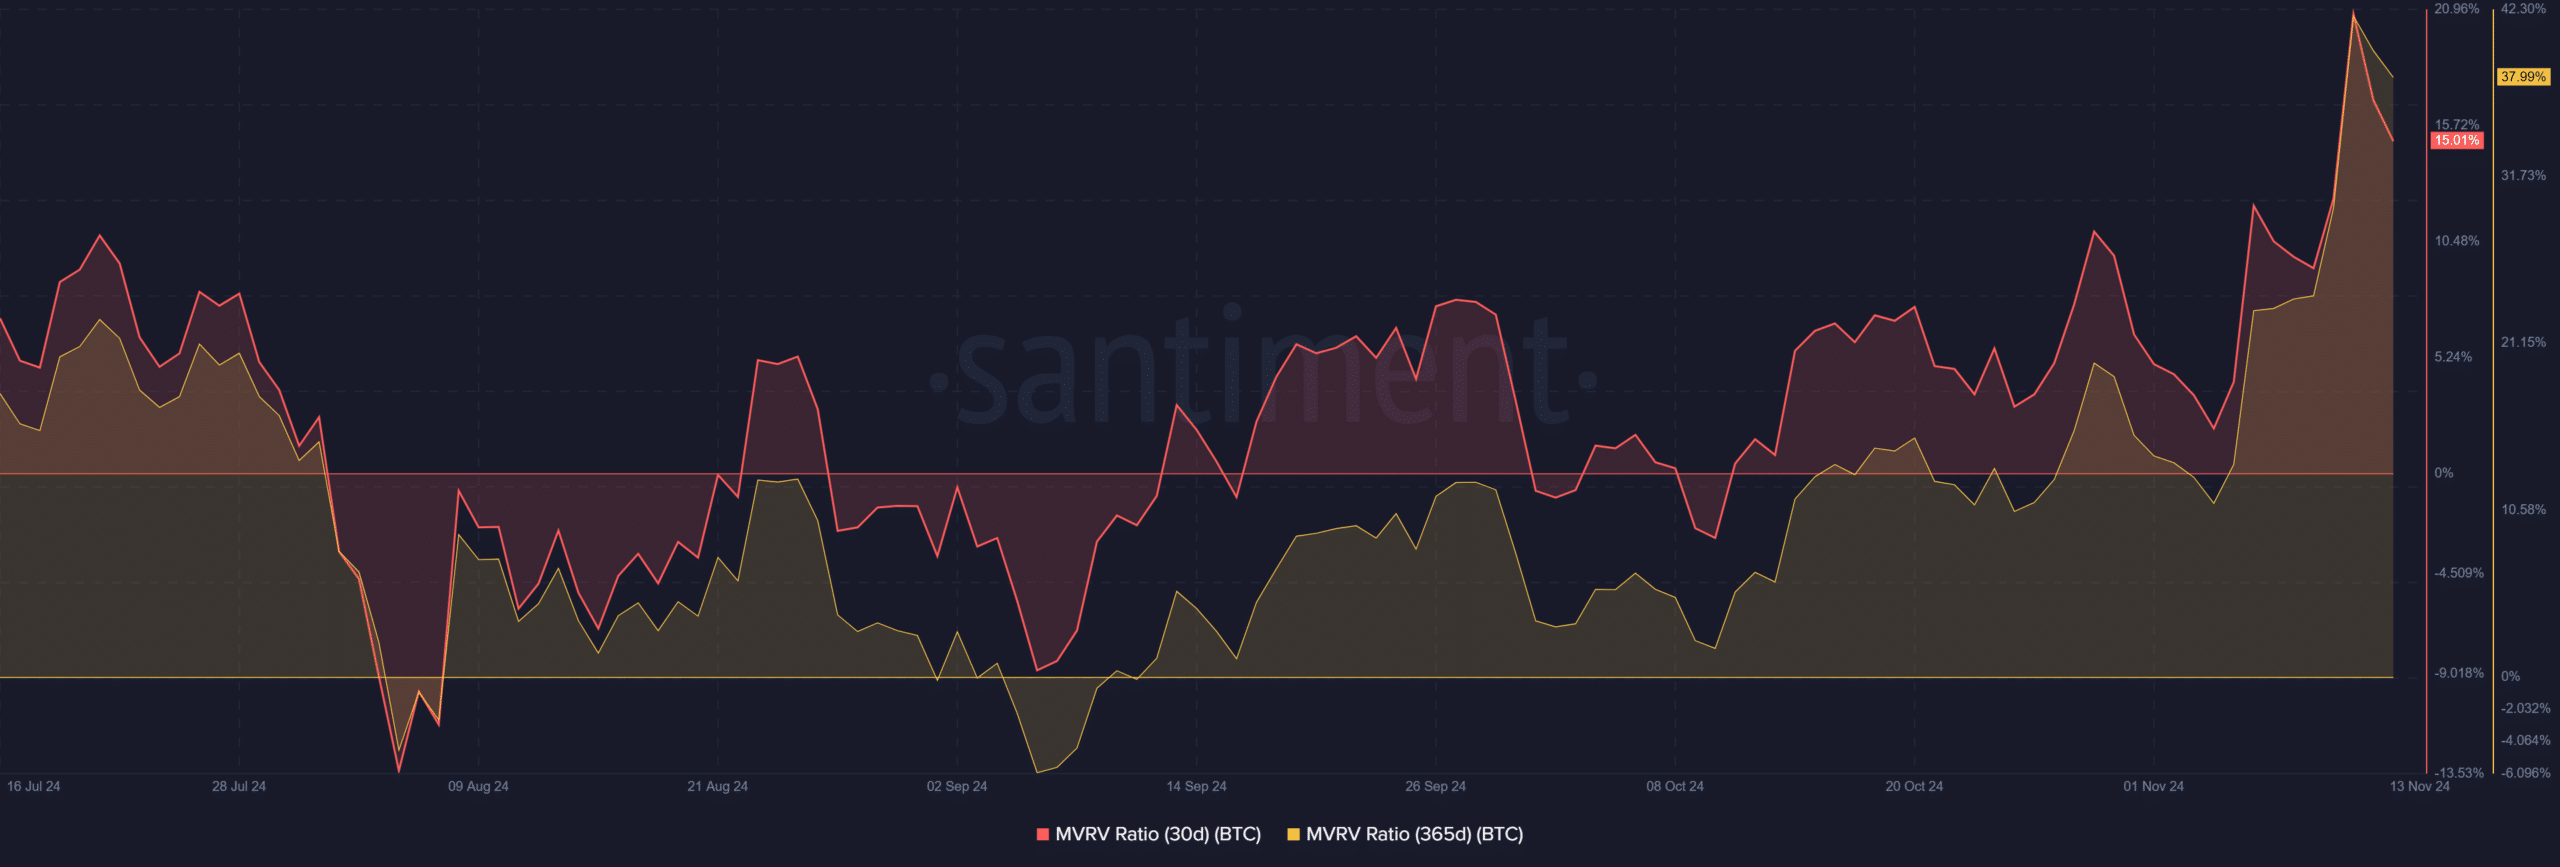
- The MVRV is at its highest level in over a year.
Bitcoin [BTC] is the focus of investor attention, driven by recent record highs and significant shifts in on-chain metrics.
Of these indicators, the ratio between market value and realized value (MVRV) provides insight into potential market behavior. At the same time, the Global In/Out of the Money (GIOM) data provides a view of holder profitability.
Together, these statistics reveal an interesting picture of the current state of Bitcoin.
Bitcoin MVRV ratios indicate a heated market
The 30-day MVRV ratio for Bitcoin at the time of writing was 15.01%, while the 365-day ratio was 37.99%. These levels indicate that Bitcoin holders have, on average, accumulated significant unrealized gains.
Historically, such high MVRV ratios have been correlated with periods of increased market activity, often leading to profit-taking or continued bullish momentum.


Source: Santiment
The high level of the 365-day MVRV suggests that long-term holders are seeing substantial gains, a positive sign for market sentiment and a potential trigger for increased selling pressure.
The majority of Bitcoin addresses are profitable
According to data from InTheBlok53.61 million Bitcoin addresses, representing 99.35% of all addresses, are currently making a profit. At around the current price, 69.58% is in-the-money, while 0.11% is at-the-money and 30.30% is out-of-the-money.
This breakdown highlights strong support levels, as the high percentage of in-the-money addresses indicates a strong support base for Bitcoin.
Profitable holders are less likely to sell at lower prices, while the 30.30% out-of-the-money addresses could create resistance as Bitcoin approaches a level where these holders break even, especially near historical price zones.
The data further supports Bitcoin’s bullish outlook as most holders are in a favorable position, which could boost market confidence.
BTC’s price action reflects growing volatility
Bitcoin’s price recently reached $88,666 before rebounding to $87,435 at the time of writing. This price action underlines the asset’s growing volatility as it continues to rise after the bullish breakout from the consolidation phase around $68,000.


Source: TradingView
The daily chart shows a strong uptrend, supported by the 50-day and 200-day moving averages, currently $68,321 and $64,148 respectively.
The recent rally has pushed Bitcoin into overbought territory, as evidenced by the Relative Strength Index (RSI) at 84.88. This signals a possible cooling-off phase before further upward movement, especially if profit-taking intensifies.
Key support levels to watch include $85,000 and $80,000, while resistance is expected near $90,000 and $95,000 as Bitcoin moves closer to the psychological $100,000 mark.
Market Outlook: Caution or Continuation?
The combination of high MVRV ratios and overwhelmingly profitable addresses paints a bullish picture for Bitcoin.
Read Bitcoin (BTC) price prediction 2023-24
While some resistance may emerge as out-of-the-money addresses attempt to close at breakeven levels, underlying market sentiment remains bullish.
Investors will likely be keeping a close eye on these numbers as Bitcoin moves into uncharted territory, with the next big milestone potentially crossing the $90,000 mark.

