

- Bitcoin is showing a double-top pattern, indicating a possible drop to $50,000.
- Despite bearish trends, optimistic long-term projections point to significant future appreciation in Bitcoin’s value.
Bitcoin [BTC] hovered above $61,000 again at the time of writing, after a brief dip to $58,000 the previous day, and showed signs of recovery with a 24-hour high of $62,949.
However, at the time of writing, Bitcoin was trading at $61,200, reflecting a decline of 1.2% in the past 24 hours.
This pattern of rapid recovery followed by setbacks is sparking debate among crypto analysts, who foresee a possible further decline towards the $50,000 level.
Double top shows further decline to $50k
This bearish sentiment is reinforced by the formation of a ‘double-top’ price pattern, a technical indicator that often heralds upcoming bearish trends.
The pattern, characterized by two consecutive highs of similar heights separated by a low, suggests that Bitcoin could not only revisit but possibly break through the $50,000 threshold.
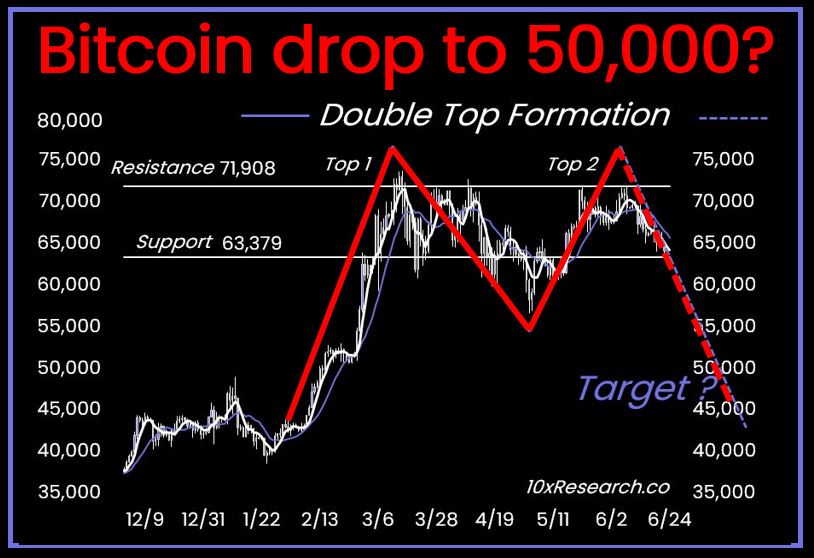
Source: 10x Research
This scenario is seen as increasingly likely given Bitcoin’s struggle to overcome established resistance levels, pointing to potential vulnerabilities in the current market strength.
The concept of a double top pattern in trading is important because it typically signals a reversal from a previous uptrend.
10x Research has marked that Bitcoin is exhibiting this pattern, which has historically preceded significant price declines.
According to their analysis, if Bitcoin fails to hold above the critical support level, it could lead to a sharp decline, possibly as high as $45,000.
The company’s market insights show that this bearish pattern is strengthening, supported by observations of trading in ranges between $60,000 and $70,000.
The potential transition from this trading range to a top formation could pose problems for retail investors, especially as many altcoins tend to follow Bitcoin’s lead and could also experience significant declines.
Other analysts, including Dylan Leclair, have done so noted signs that could point to a possible drop in Bitcoin’s price to around $50,000.
Leclair highlights recent trends in the derivatives market, such as a decline in open interest and funding rates for perpetual futures as Bitcoin stabilizes below its previous high of $69,000.
This stabilization has resulted in fewer leveraged long positions chasing all-time highs, and although there is a risk of liquidating long positions around $50,000.
Leclair noted:
“I find it quite unlikely that we will reach that level again (but not impossible of course!).”
Source: Dylan Leclair on X
Bitcoin Fundamentals: Backing Up the Bearishness?
The looming question now is whether Bitcoin’s fundamentals point to a further decline. A deep dive into Bitcoin’s key fundamental metrics sheds some light.
Santiment, for example facts BTC social volume shows a spike in mentions of “bottom,” indicating increased bearish sentiment.
This is one of the highest social volume and dominance spikes for the term in the past year, signaling a potential further downside.

Source: Santiment
Moreover, CryptoQuant facts indicates that Bitcoin’s MVRV ratio – a measure that compares Bitcoin’s market value to its realized value – is closely tracking the price decline and currently stands at 1.96.
Read Bitcoin’s [BTC] Price forecast 2024-2024
The ratio suggests that Bitcoin’s market value is almost double its realized value, which may indicate that the price is relatively overvalued and may correct further.
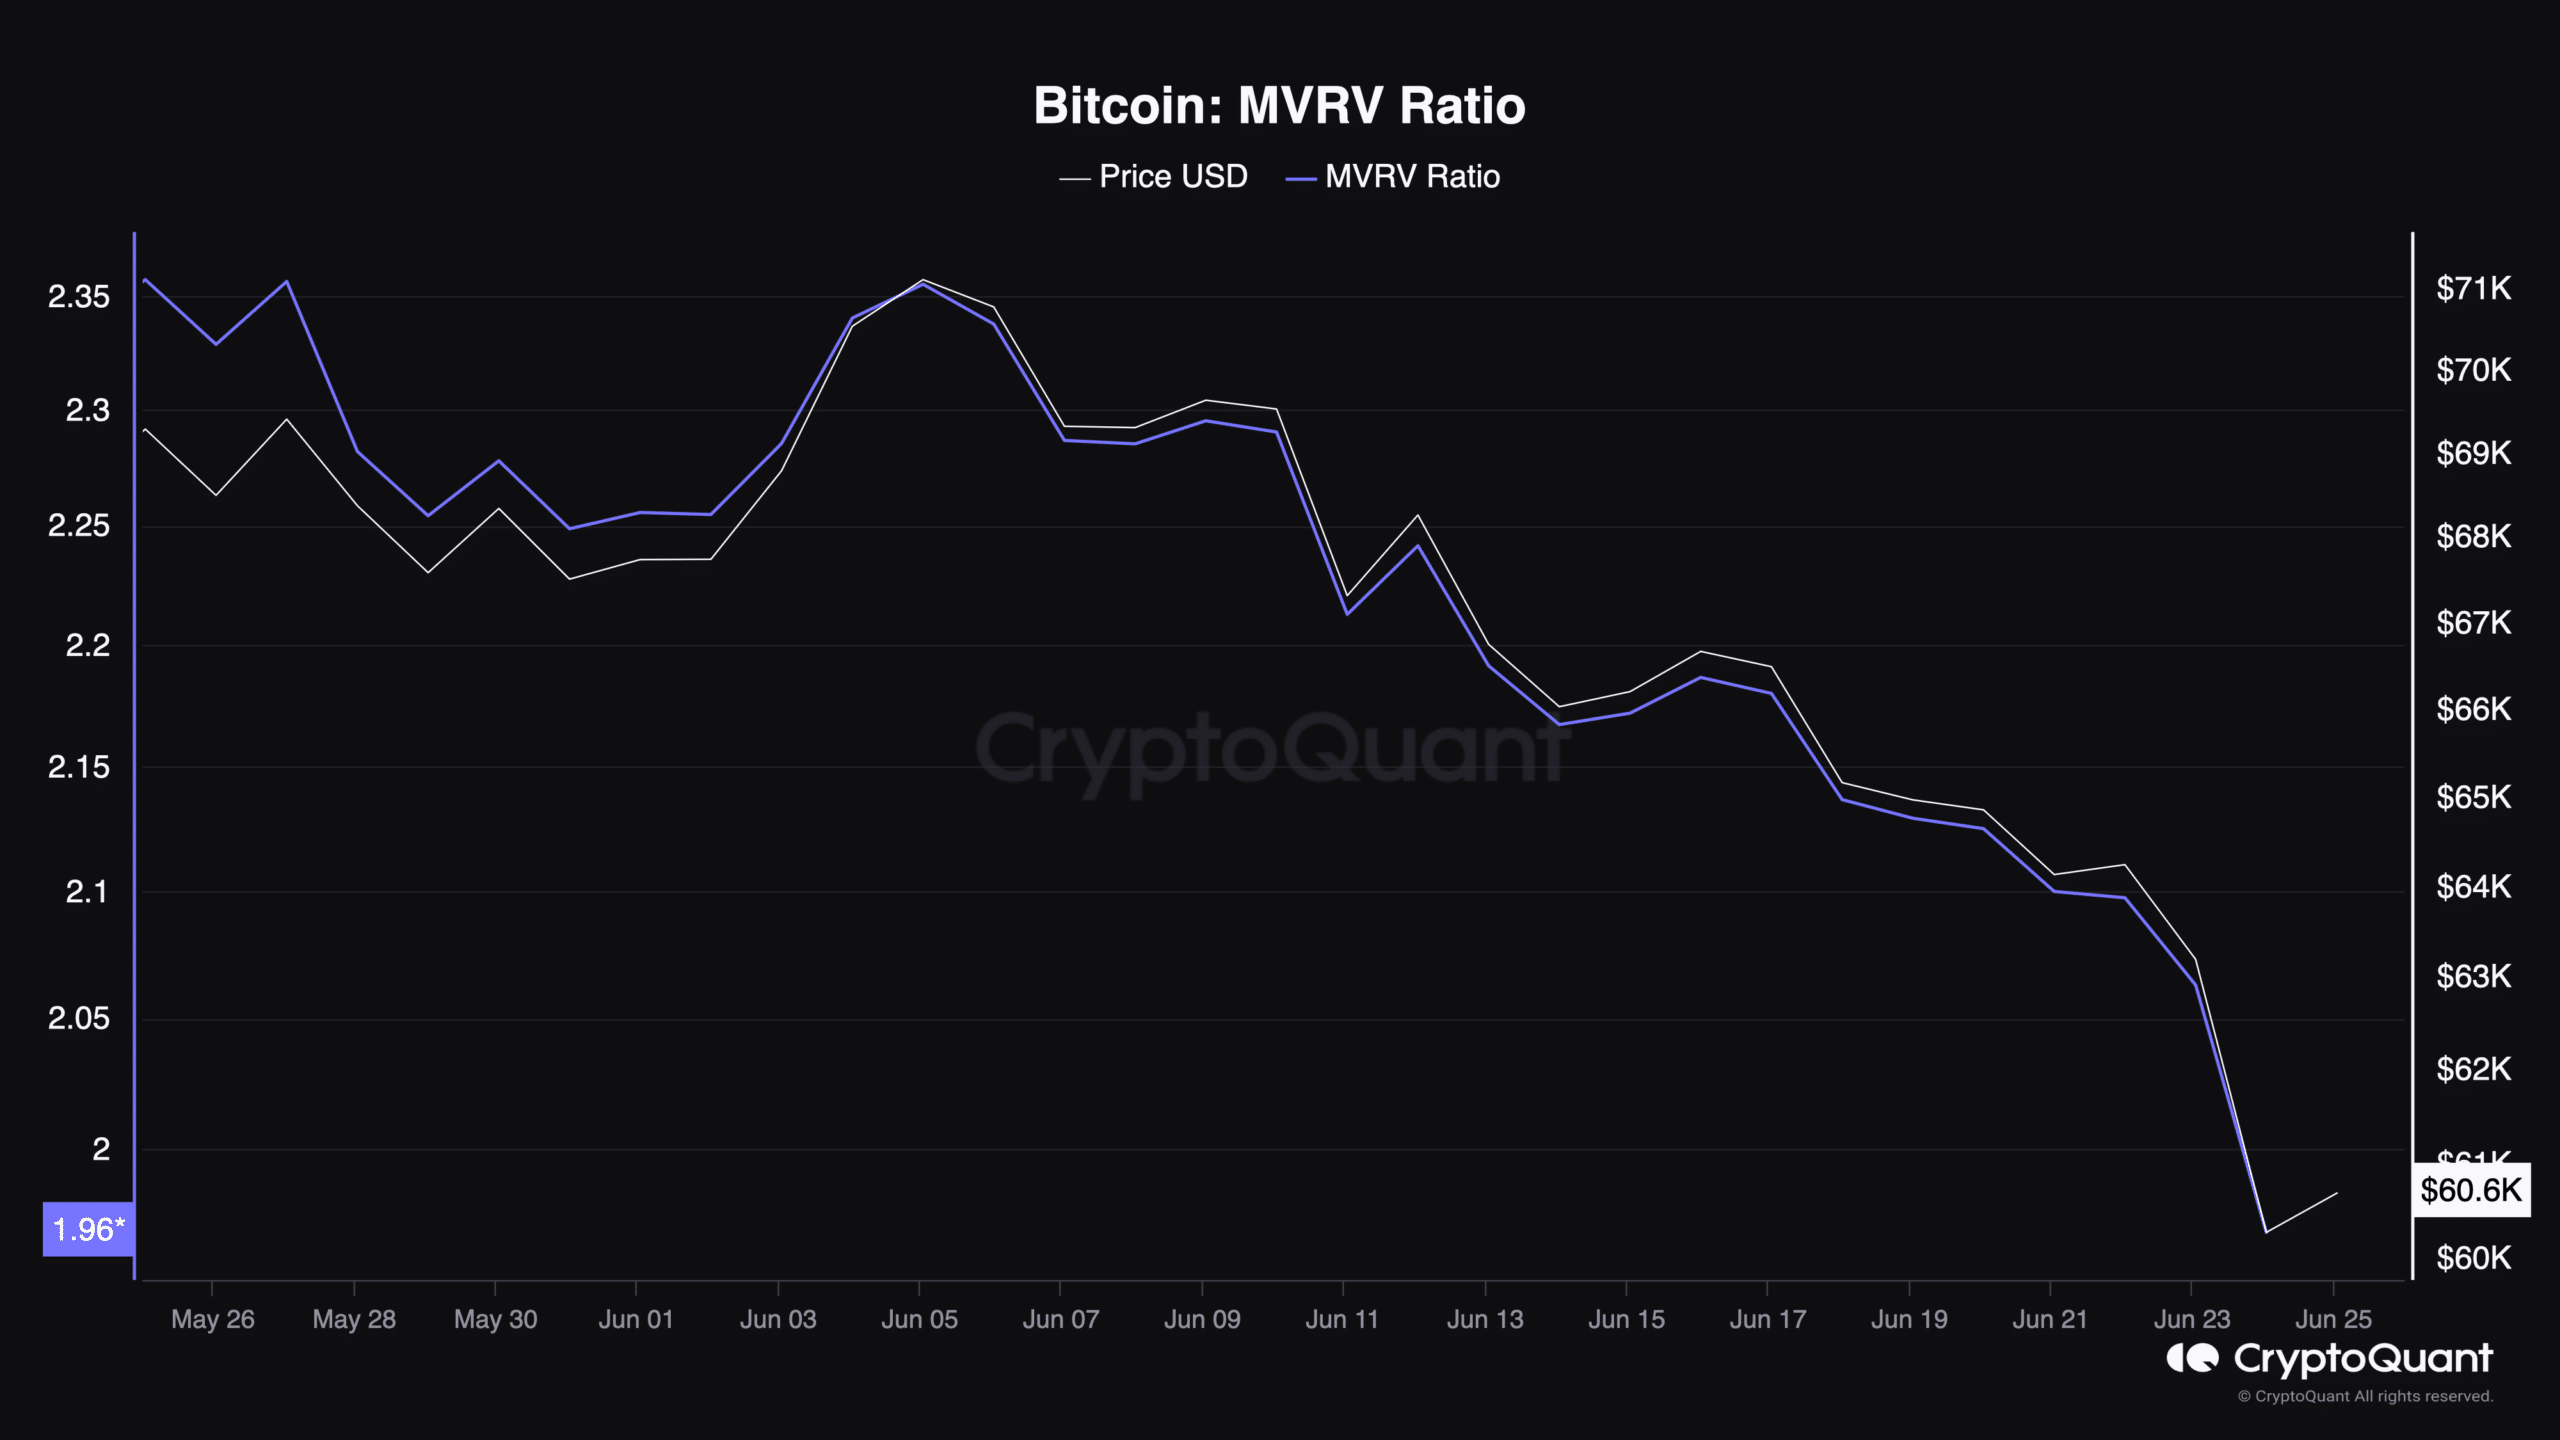
Source: CryptoQuant
Despite these bearish indicators, Strike CEO Jack Mallers maintains an optimistic long-term view, envisioning a future where Bitcoin reaches $1 million per coin.