

The
XRPL recorded net asset inflows of $1.9 billion over the past 90 days, ahead of Ethereum’s $1.6 billion and Stellar’s $1.4 billion, according to data from the RWA Foundation. BNB Chain followed with $848 million, Solana with $611 million, Avalanche with $362 million, Sei Network with $202 million and Mantle with $90 million.
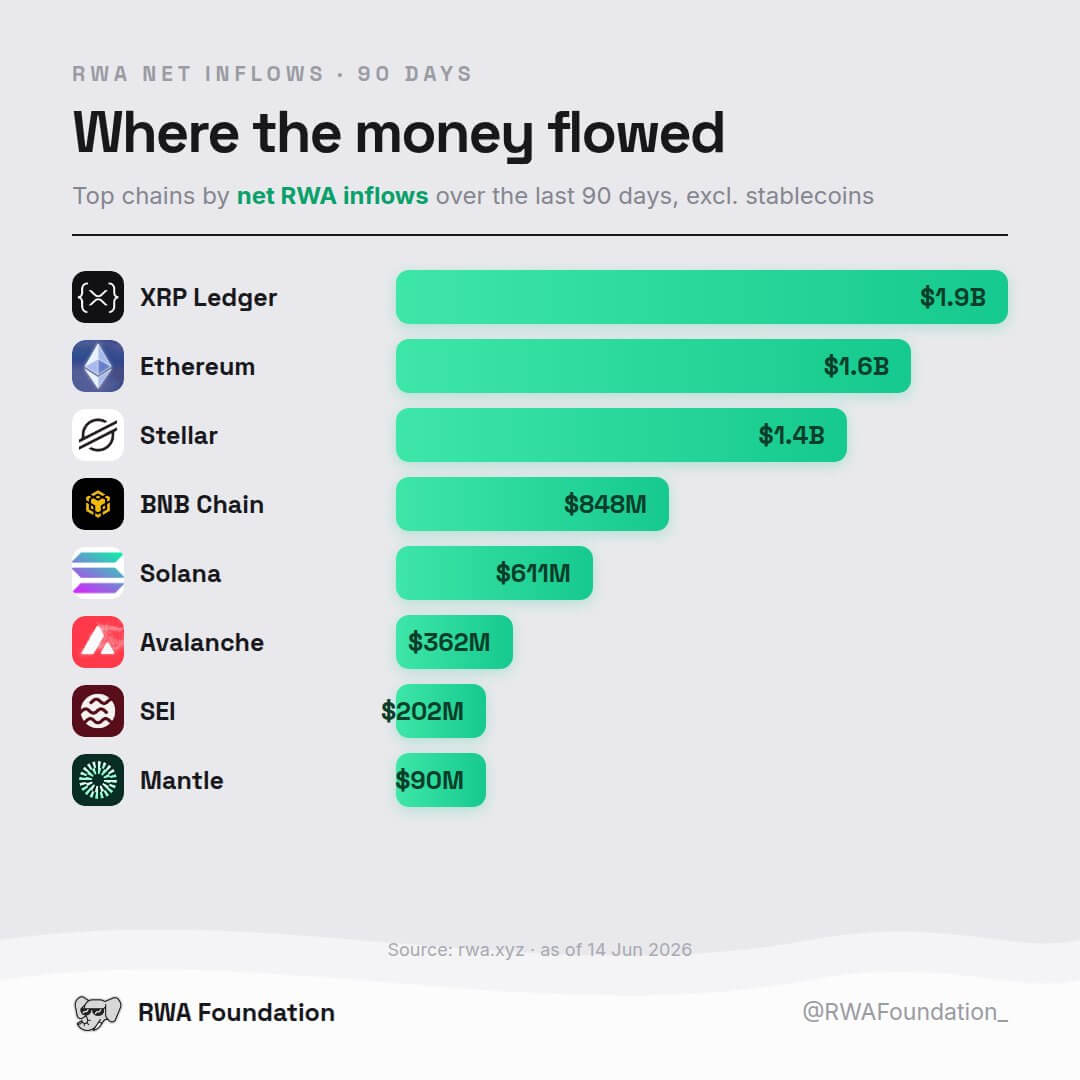
The data does not mean that XRPL has displaced Ethereum as the main venue for tokenized assets. Ethereum still owns more than half of the tokenized real-world asset value tracked by RWA.xyz.
However, the 90-day flow rankings show that new capital is moving more aggressively toward XRPL, at a time when XRP derivatives and exchange rate data are also improving.
New RWA Money Tests Ethereum’s Lead
The acceleration of capital movement into the XRP Ledger underlines a changing competitive dynamic among Layer 1 networks competing for institutional issuance.
Tokenized real-world assets (RWAs), which range from digitized sovereign debt and private credit to multi-asset funds, have expanded significantly.
Facts from platform RWA.xyz indicates that the global market has reached $33.5 billion in distributed asset value, in addition to $350 billion in more broadly represented asset value.
While Ethereum remains the leading venue for tokenized assets, with a 52.8% market share and approximately $17 billion worth of tokenized assets, its growth rate has faced stiffer competition from alternative chains.
Ethereum’s asset base grew by approximately 35% over the course of 2026, a substantial increase from the baseline, but a contraction that is currently surpassed by XRPL on a relative short-term basis.
According to a recent analysis from institutional treasury firm Evernorth, XRPL’s growth trajectory is at the top tier of established legacy networks.
Analysts at the firm noted that the deployment of institutional capital on the XRPL is different due to its structural makeup, especially when compared to similar infrastructures such as Stellar, Avalanche and Solana.
Evernoth pointed out that the inflows into the XRPL network are mainly driven by treasury-scale episodic commitments and not by fragmented retail transactions.
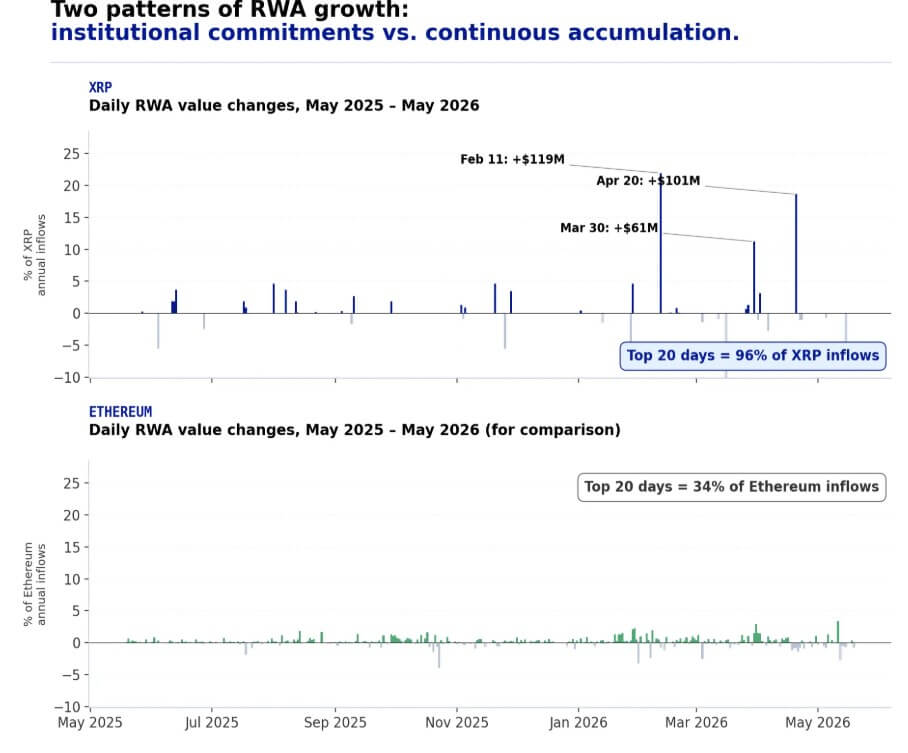
This pattern is consistent with institutional betting behavior, where large-scale financial entities undertake large programmatic issuances of bonds and funds in separate tranches rather than gradual market accumulation.
XRPL’s RWA footprint
Measuring network activity within the real asset segment requires strict technical distinctions to avoid mischaracterizing on-chain liquidity.
On the XRPL, data from RWA.xyz splits the network footprint into two specific accounting layers: distributed asset value and displayed asset value.
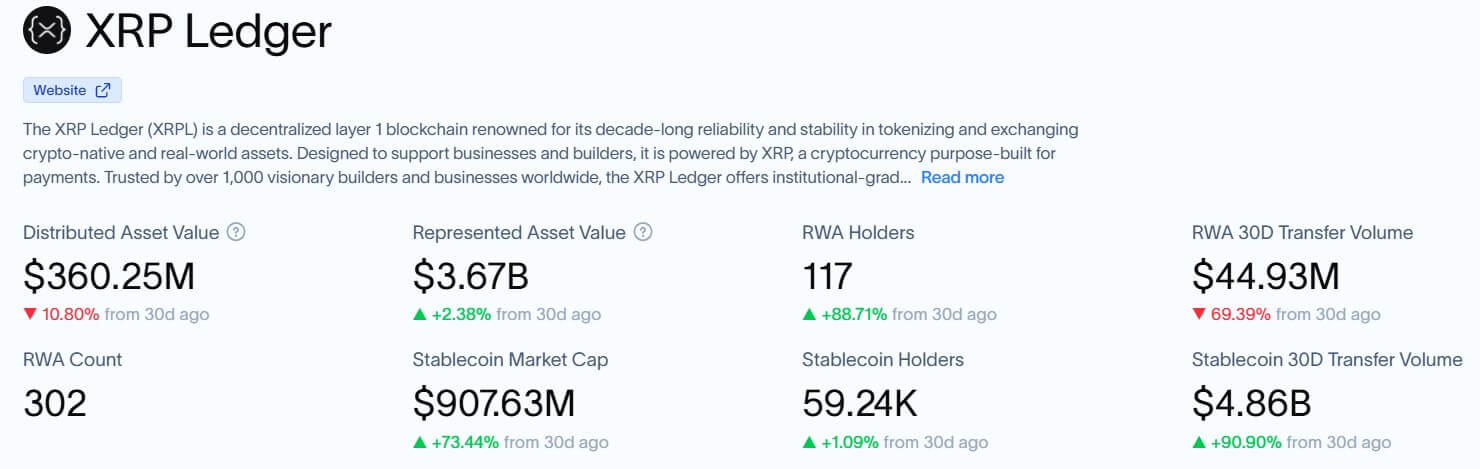
Currently, the total tokenized assets represented on XRPL are approximately $3.6 billion. This layer records financial assets that use the ledger for tracking, compliance, or structural representation.
In contrast, the network’s actively distributed asset value, which represents assets originally settled and circulating within decentralized protocols, is $360.25 million.
This multi-layered architecture is used by commercial banking institutions and asset managers to test the structural efficiency of tokenized fixed income securities and fund products. The operational plumbing relies heavily on the underlying stablecoin liquidity to efficiently settle these transaction flows.
On-chain metrics reflect an expansion of this specific settlement infrastructure. The stablecoin market cap on the XRPL reached $907.63 million, marking an increase of 73.44% over a rolling 30-day period.
Accordingly, active transaction rates have increased, with 30-day stablecoin transfer volumes increasing 90.90% to $4.86 billion.
Ripple has continued to adapt its infrastructure footprint to absorb this institutional activity, promoting payment trails through corporate integrations and ramping up operational settlement mechanisms associated with its RLUSD stablecoin.
Upbit becomes the center of XRP trading
The fundamental momentum within the XRPL coincides with a pronounced, albeit fragmented, return of liquidity to the underlying XRP cryptocurrency.
Data from CryptoSlate shows that the token is up over 5% in the last 24 hours, testing intraday highs of $1.29 before moderating to trade around $1.24.
The price increase came against a broader emerging crypto market fueled by the US-Iran peace deal.
However, detailed portfolio analysis shows that the capital flows underlying this market structure are unevenly distributed across international trading centres.
According to blockchain data published by CryptoQuant, portfolio flow dominance has experienced a sharp geographic rotation rather than uniform global buying pressure.
Data tracking net wallet flows shows that deposit and withdrawal activity has been heavily concentrated in South Korea through Upbit, the country’s largest digital asset exchange. Upbit’s share of global XRP wallet dominance rose from 13% on June 7 to 31% on June 14, representing the highest concentration of network interaction since May 2024.
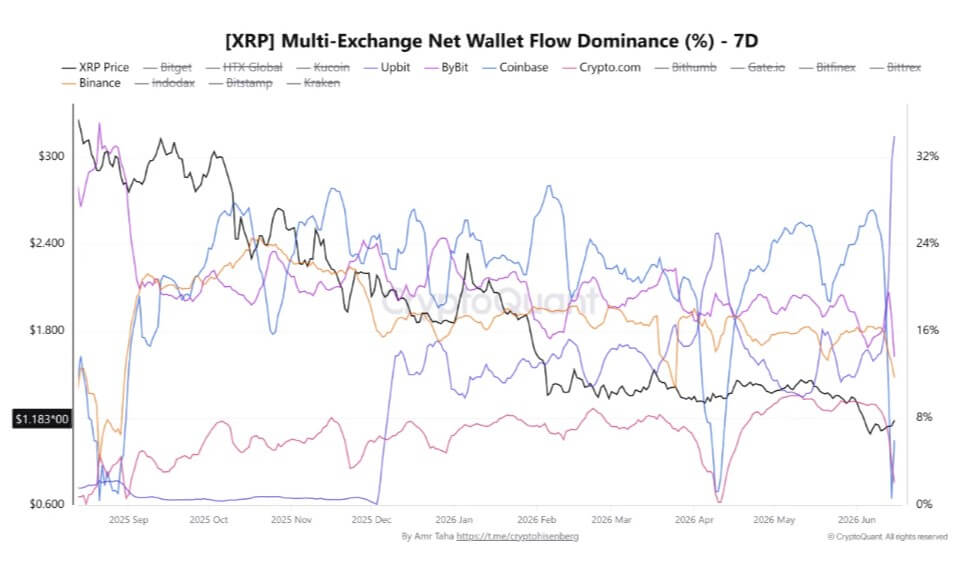
This local acceleration is in stark contrast to Western platforms, which have simultaneously experienced a decline in their dominance.
Coinbase’s portfolio flow dominance fell from 27% on May 7 to 0% on June 14, indicating a near-total normalization or halt in net deposit activity relative to global volumes. During the same period, Binance’s dominance fell from 16% to 13%, and Crypto.com saw a contraction from 9% to 3%.
This internal divergence shows that ongoing market participation is structurally divided, driven primarily by intensive capital rotation within East Asian trading platforms rather than a broader retail resurgence on US or European platforms.
Derivatives markets are recovering without excessive debt
The shifts in the spot market are reflected in the cryptocurrency derivatives complex, where open interest metrics point to a disciplined rebuilding of risk positions.
On Binance, which serves as the main clearing venue for digital asset futures, the 30-day moving average for XRP open interest climbed to the highest level in more than four months.
CryptoQuant declared that the total open interest within the contract reached approximately 486.8 million XRP, with the 30-day moving average stabilizing at 484.8 million XRP.
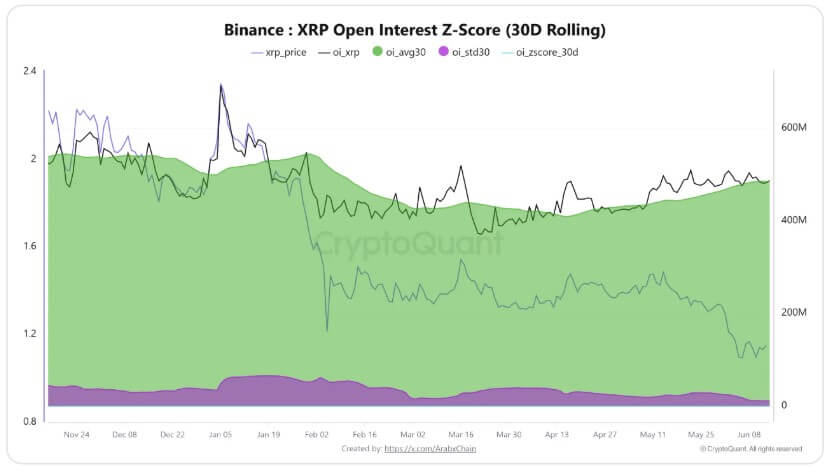
The steady upward arc follows a multi-month long correction that has cleared accumulated debt from the system, indicating a methodical return to positioning rather than speculative highs.
Further analysis of this positioning suggests that the current market structure remains balanced, with the XRP Open Interest Z-Score recorded at 0.19.
Staying firmly within normal historical ranges, the indicator suggests that the rise in open interest is the byproduct of a gradual accumulation of directional and hedging positions, rather than unhedged leverage.
This measured build-up suggests market participants are positioning for structural volatility rather than immediate speculative liquidations.