

There is a clear distinction between possibility and reality in the market structure.
June has already started with bearish predictions taking the market by storm. Looking at how the month has started with Bitcoin’s nearly 20% correction, it’s no wonder the market is now pricing in a deeper correction, with multiple headlines pointing to different year-end targets.
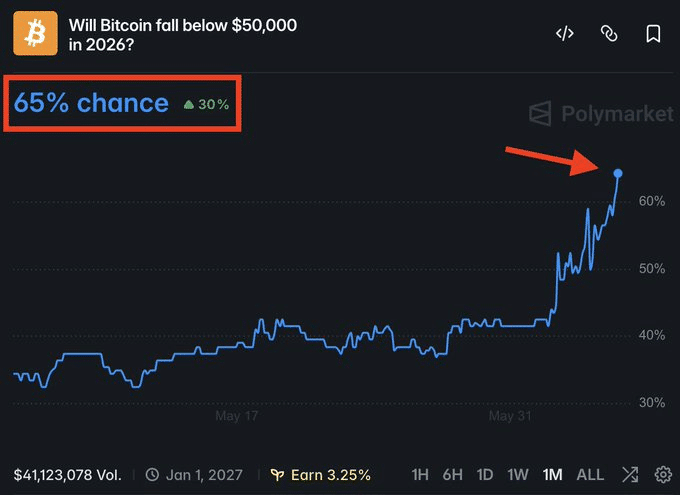
According to the latest Polymarket odds, there is a record high 65% chance that Bitcoin will fall below $50,000 by 2026. Some traders are even pricing in a deeper correction towards the $43,000 level, reflecting how quickly sentiment has changed as volatility extends to the downside.
But the question remains: is this just a sentiment-driven move as macro volatility hits the market?
According to the Crypto Fear and Greed Index, the market has officially entered an “extreme fear” phase, historically aligned with capitulation-like moves, as confidence in the broader rally begins to fade.
At the same time, this stress is clearly spreading to the derivatives market.
According to data from CoinGlass, nearly $500 million was wiped out of Bitcoin long positions in less than 48 hours, while BTC fell below $60,000 for the first time in almost four months.
The last time prices fell in this zone, it triggered a recovery in March (1.8%) and April (11.8%), suggesting that sharp upswings previously coincided with short-term recovery phases.
However, an important difference could be that this Bitcoin [BTC] predictions are not just random noise, but part of a broader repricing of risk across the market.
Bitcoin sees its major premium compression
Not every capitulation phase signals a deeper crash ahead.
As noted earlier, the dip towards $59,000 in early February is a clear example. In this context, Bitcoin is print the largest capitulation of short-term holders in its entire history, with forced sales accelerating.
However, that doesn’t automatically mean that failure is guaranteed from now on, making these predictions more noise than conviction at this stage.
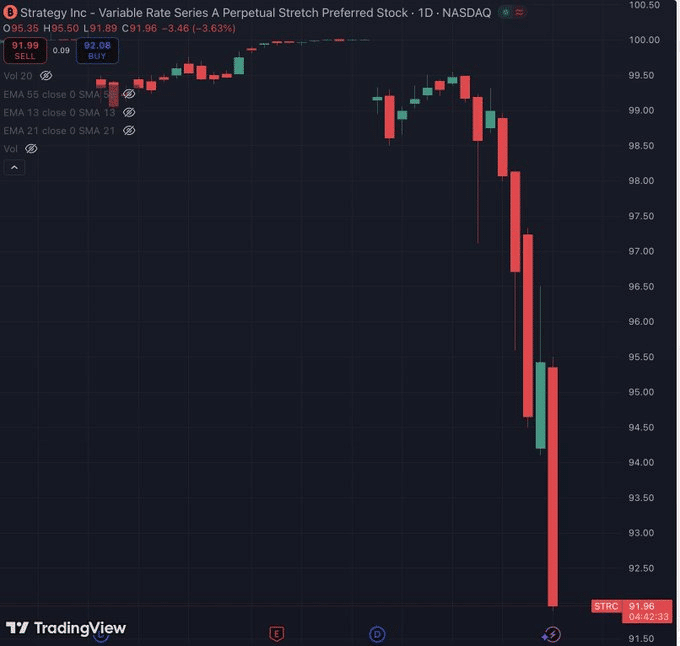
However, the difference becomes more apparent as the impact extends beyond short-term holders. As the chart below shows, Stretch [STRC] has fallen below $92 as sales accelerate, widening the discount to its $100 face value, while Bitcoin has fallen to around $60,000.
This move puts even more pressure on Strategy [MSTR] financing model and Bitcoin positioning.
Essentially, Bitcoin is losing one of its main sources of marginal purchasing power.
According to AMBCrypto, it is this divergence that makes these predictions less arbitrary and more tied to the current market structure.
The logic is simple: strong hands remain under pressure while weaker participants continue to exit, causing positioning shifts to cause more price movement than short-term noise.
This in turn highlights why Bitcoin’s collapse below $50,000 is not just a market overreaction, but a potential “reality” that is shaping up as positioning, liquidity and forced selling continue to occur.
Final summary
- Fears are rising rapidly, with liquidations and weak flows pushing Bitcoin lower and fueling bearish expectations.
- Buying pressure is easing, so price is now determined more by positioning and forced selling than by sentiment alone.