

Veteran trader Peter Brandt lays out a highly conditional long-term path for Bitcoin that points to a potential peak between $300,000 and $500,000 in late 2029, even as he claims the market still hasn’t produced the kind of action that typically marks a sustainable bottom.
In a post on
Brandt therefore imposed one condition: that Bitcoin continues to respect the cyclical behavior that he believes has determined its value over the past fifteen years. That leaves the setup to do a lot of work in the short term. Before a cancellation scenario for 2029 comes into view, Brandt indicates that the current structure still looks incomplete.
Why Brandt isn’t calling a Bitcoin bottom yet
That skepticism was more evident in his response to a chart from JDK Analysis. Brandt’s response was blunt: “This doesn’t look like a bottom.”
Related reading
JDK’s graph argued that recent progress is in the nature of a ‘short reaccumulation’, but only in a probabilistic sense. The analyst wrote: “As long as bulls fail to show clear strength and persistence, the current low does not qualify as a strong bottom. This is purely a probabilistic view!”
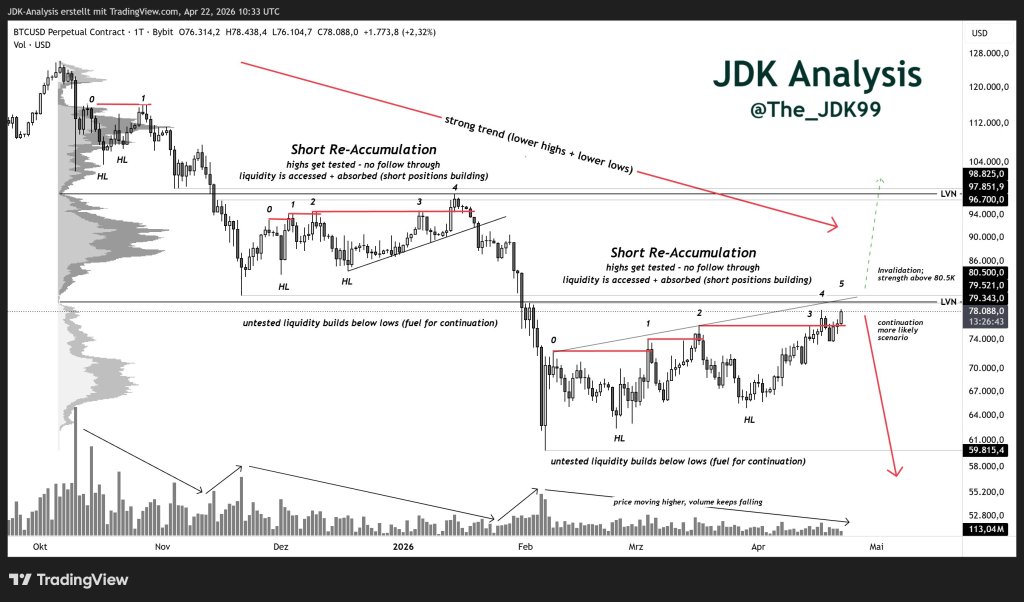
The setup highlighted repeated tests of local highs, declining volume as the price moved higher, and a void level above around $80.5K, while suggesting that a continuation lower would remain more likely if buyers fail to force a clear breakout.
Brandt also reinforced famed chartist Aksel Kibar, calling him “the most accomplished purely classical chart analyst alive today.” Kibar’s view of the market was less about prediction than process, but the message was similar: technical structures are provisional until price confirms them.
Related reading
“Sometimes I get criticism from followers who have a point of view and want to see updates that confirm that point of view on ‘adjusting’ the borders,” Kibar wrote. “Well, as the market provides new information, we have to adapt. We cannot be dogmatic about our analysis. What looks like a wedge could turn into a channel. What looks like a bearish continuation could break above the channel boundary and require action.”
That comment was attached to a BTC chart that showed exactly that kind of morphing structure. What previously looked like a rising wedge was reinterpreted as a more clearly defined channel, with several rejections at the upper boundary.
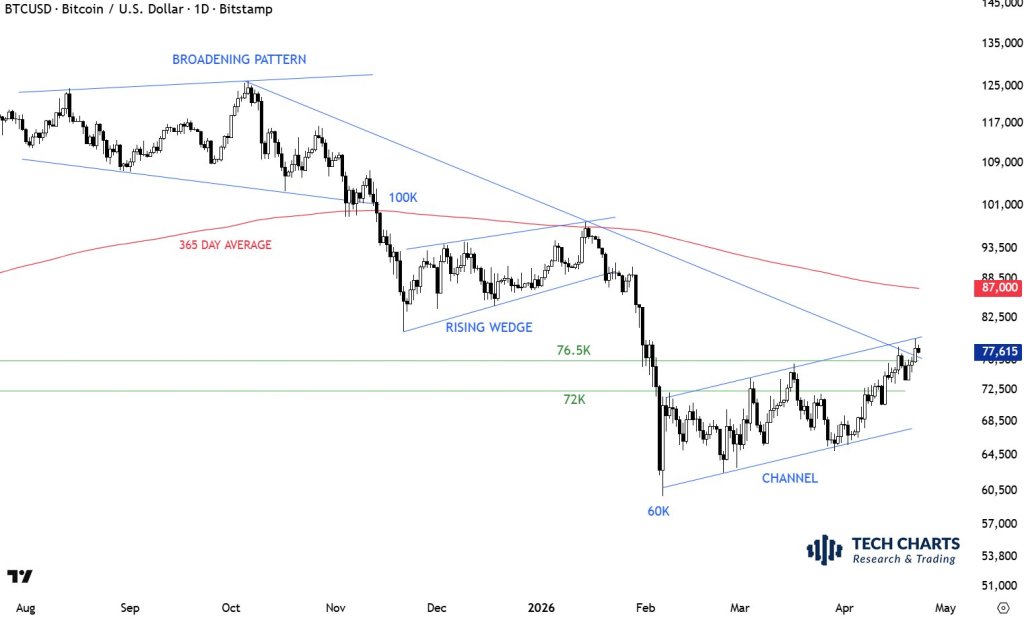
The chart also shows that Bitcoin is still trading below a rising resistance line and below the 365-day average near $87,000, with a late February washout towards $60,000 followed by a recovery to the upper $70,000 area. Nearby levels around $76,500, $72,000 and the low $80,000 seemed crucial in the current battle.
At the time of writing, BTC was trading at $78,196.
Featured image created with DALL.E, chart from TradingView.com