

Bitcoin’s recent surge has traders on edge, but the picture isn’t all one-way. Reports point to heavy losses for late buyers, and on-chain figures show real money is changing hands as positions are forcibly closed. The markets moved quickly; the mood too.
Related reading
Fear and greed drop to single digits
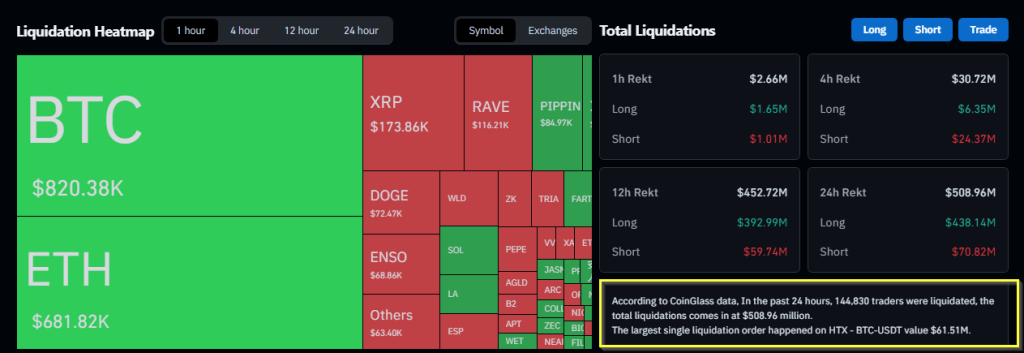
According to MintGlassmore than 144,839 traders have been liquidated in the last 24 hours, with total liquidations exceeding $508 million and approximately 92% tied to long bets.
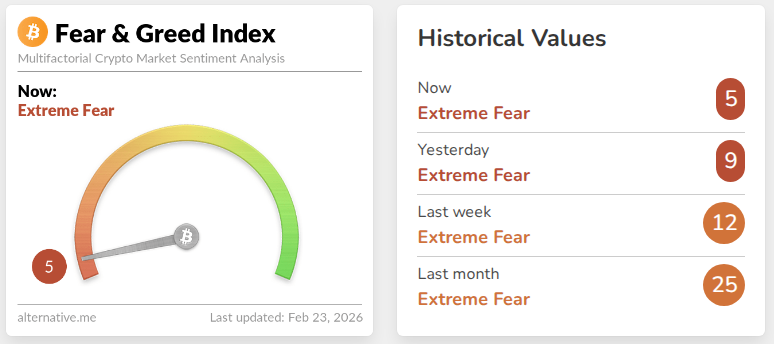
Reports from Alternative.me put the Crypto Fear and Greed Index at 5 out of 100 – a value that has only surfaced three times since 2018.
That level screams for panic. Yet panic often clears out the most vulnerable holders, leaving room for steadier hands to intervene.
Realized losses and capitulation signals
Based on reports from Glassnode, recent investors are still posting losses at a high rate: the seven-day moving average for net realized losses was almost $500 million per day.
That kind of selling pressure looks brutal on a chart. At the same time, selling at scale can end a sharp downturn, as the number of people left to sell decreases as prices continue to fall.
Bitcoin price action
In the midst of all this, price movements matter. Bitcoin rose to around $68,600 on Saturday but fell back to reach the mid-$64,000s after a wave of exits.
Traders are seeing a range that formed after early February drop to around $60,000. The coin remains roughly 48% below its October high of $126,000 and about 5.5% below its 2021 peak near $69,000.
News tied to Tension between the US and Iran and the general risk-free trading pushed some traders into safer assets, further fueling the decline.
Sharpe ratio reaches unusually low
Analyst Michaël van de Poppe shared a chart with Bitcoin’s Sharpe Ratio at -38.4. This metric measures return relative to risk; such a low number is rare.
This is a phenomenal graph.
It shows the Sharpe ratio for #Bitcoin in the short term.
The key takeaway: The Sharpe Ratio has fallen to -38.38, which historically marked low-risk accumulation zones. The red circles mark each time the Sharpe Ratio dropped to similar… pic.twitter.com/Nwp7SkfVP4
— Michaël van de Poppe (@CryptoMichNL) February 21, 2026
Historically, extremely negative numbers have sometimes been associated with times when buying risk felt lower because the potential downsides had been suppressed by major sell-offs.
That doesn’t guarantee a recovery, but it does change the way investors view the trade-off between reward and risk.
Related reading
What this could lead to
Some technical observers warn that more support testing could occur if uncertainty continues. Others point to the combination of heavy liquidations, deep fear signals and large realized losses as signals that a base could be forming.
Previous on-chain figures show that panic and steep losses often precede calmer periods in which buyers slowly return.
Featured image from Unsplash, chart from TradingView