

Expectations around XRP exchange traded funds were seen as an inflection point that could unlock new institutional demand and change the price structure of XRP in favor of buyers. However, recent on-chain data shows that the price reaction has deviates enormously from that story.
Statistics tracked by on-chain analytics platform CryptoQuant point to a very different dynamic unfolding beneath the surface, one that explains why the altcoin continues to struggle for traction despite headline optimism and inflows into Spot XRP ETFs.
Related reading
The influx of whale fairs exposes supply pressures
Data from the on-chain analytics platform CryptoQuant shows an interesting trend among XRP whale addresses and their activity on crypto exchange Binance. A closer look at the Binance Inflow-Value Band chart shows that recent XRP deposits on exchanges are overwhelmingly concentrated in the 100,000 to 1 million XRP range and transactions of over 1 million coins.
These are not retail-sized moves. They reflect the activity of large holders moving significant balances to exchanges, and this behavior is consistent with distribution or preparation for sale. The chart showing exchange inflows into Binance makes this pattern clear, with repeated inflow spikes driven almost entirely by these higher value bands, while smaller transaction sizes are relatively lower.
The chart below shows the inflow in chunks between 100,000 XRP and 1 million XRP in purple and the inflow in chunks over 1 million XRP in light blue. Most of the inflows into Binance in recent days have been characterized by these two cohorts, with some cases of inflows in chunks between 10,000 XRP and 100,000 XRP.
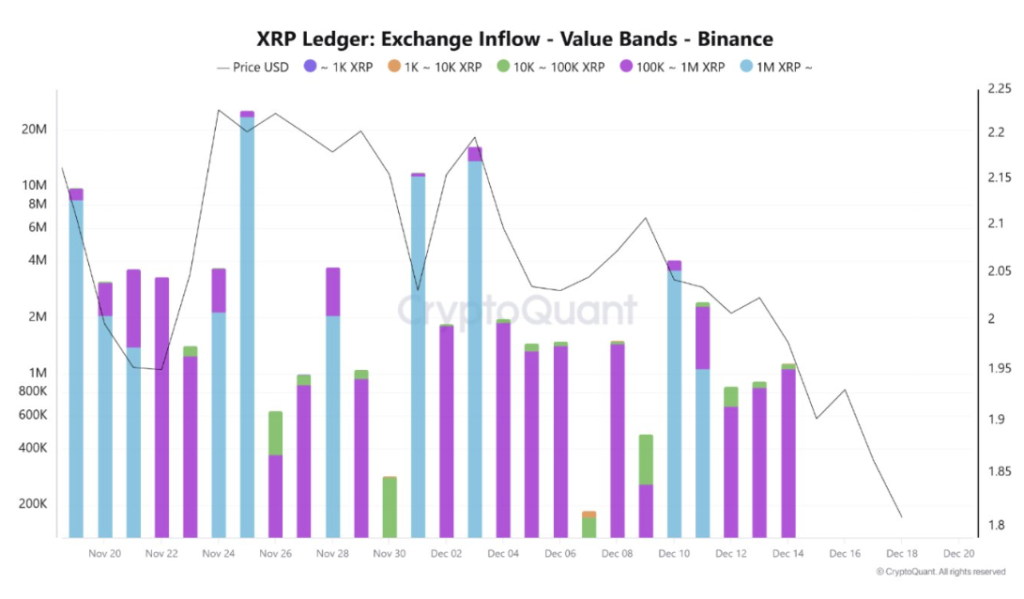
XRP Ledger: Exchange Inflow Value Bands – Binance. Source: CryptoQuant
This imbalance means that whales are adding supply to the market at a rate that smaller buyers cannot absorb, and this is why inflows into Spot XRP ETFs have failed to have a positive impact on the altcoin’s price action.
Lower highs and lower lows confirm that supply is exceeding demand
As evidenced by the price action in the chart above, the coin repeatedly printed lower highs and lower lows after major currency plunges. This is happening due to the relatively low number of new spot buyers on Binance, and even moderate selling pressure has been enough to limit the rallies.
As it stands now, the crypto faces selling pressure every time it approaches $1.95. Based on the intensity of currency inflows and the market’s reaction, the first significant support zone is between $1.82 and $1.87. However, if the large inflows continue, the data suggests that the XRP price could continue to decline towards the $1.50 to $1.66 range.
Related reading
The interpretation is that the ETF trend did not translate into sustained spot demand for XRP. Instead, whales who collected XRP before ETF approval expectations appear to have used the resulting attention a chance to dump their belongings.
That said, there could be inflows into Spot XRP ETFs helped limit the deeper downsideSoSoValue data shows that these funds recorded inflows of $82.04 million during the past week.
Featured image from Unsplash, chart from TradingView