- Bitcoin price fell 3.61% in 24 hours and reached critical support levels between $98,830 and $95,830.
- Institutional transactions soared as Bitcoin withdrawals from exchanges reached 74,052 BTC in December.
Bitcoin [BTC] has experienced a recent decline in price and portfolio returns, with crypto trading taking off $95,397, at the time of writing. This meant a 24-hour price drop of 3.61% and a weekly drop of 1.95%.
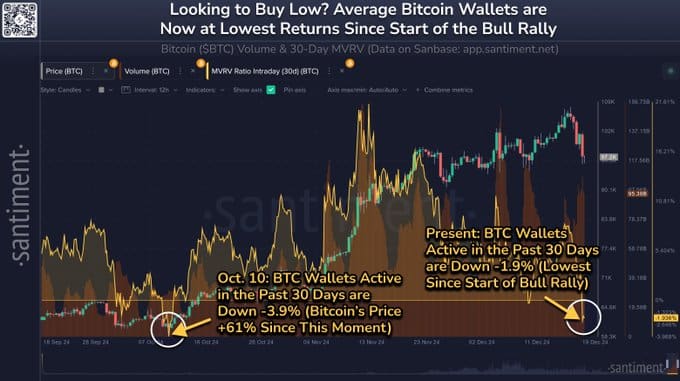
Despite hitting an all-time high earlier this month, Bitcoin’s 30-day market value-to-realized value (MVRV) measure was -1.9%. This is the lowest since the bull rally started in October.
According to Santiment, this negative MVRV suggests that many traders bought during a period of high euphoria and are now facing unrealized losses.

Source: Santiment
Santiment pointed out that Bitcoin’s historical average MVRV was 0%, reflecting its nature as a zero-sum market. Negative MVRV levels can indicate buying opportunities, as losing positions can indicate undervaluation.
The platform suggests a dollar-cost averaging (DCA) approach for traders looking to take advantage of these conditions.
Key support levels and future price projections
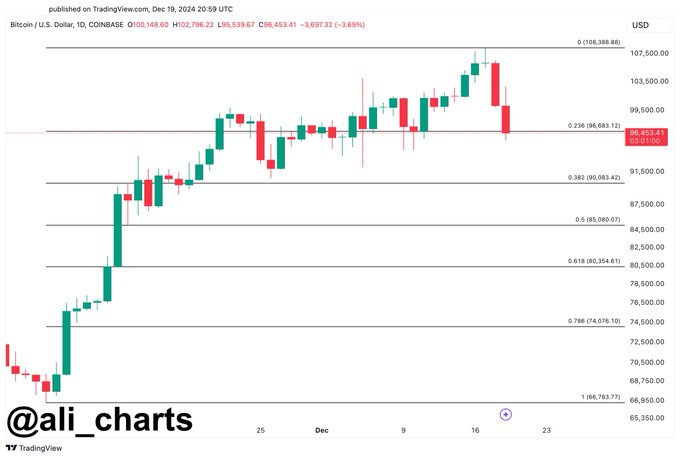
Crypto analyst Ali emphasized the significance of Bitcoin’s support is between $98,830 and $95,830. Within this range, 1.09 million wallets collectively purchased over 1.16 million BTC, making this a crucial level to monitor.
A breakdown below $96,000 could trigger a decline to $90,000 or $85,000 based on the Fibonacci retracement levels.

Source:
Ali too pointed out the continued trend of Bitcoin withdrawals from exchanges, with 74,052 BTC removed from exchanges in December alone.
This pattern suggests a shift toward long-term ownership, as coins delisted from exchanges are less likely to be sold.
Market statistics and trading activity
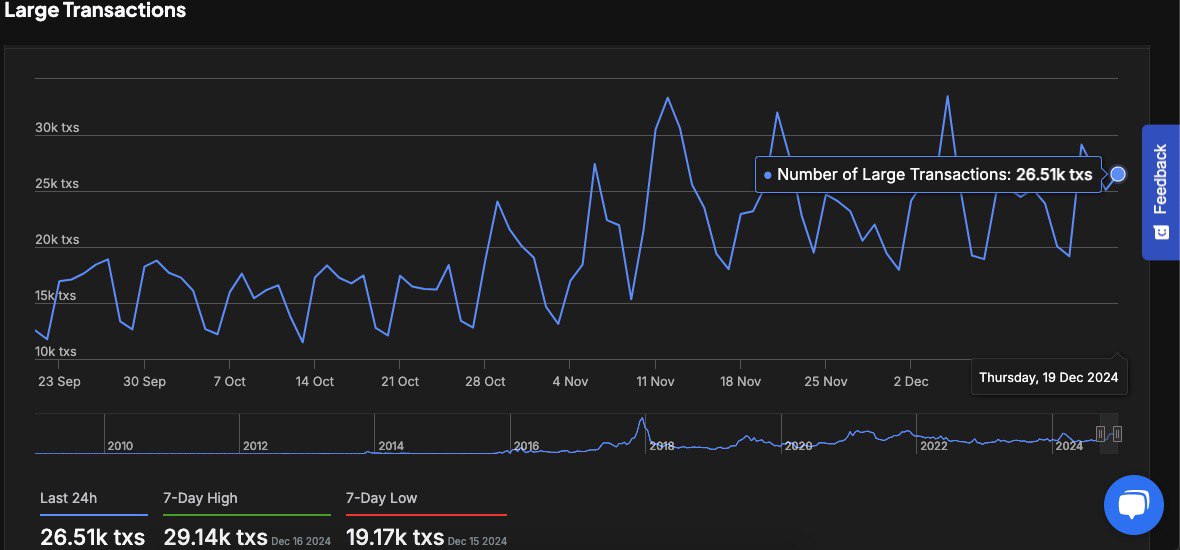
Recent data from IntoTheBlock indicates increased activity on high value transactions of $100,000 or more. On December 18, 26,510 large transactions were recorded, slightly below the seven-day high of 29,140.
Spikes in such transactions have been observed during periods of volatility, especially in October and November. The continued volume of these trades reflects continued interest from institutional or high-net-worth traders.

Source: IntoTheBlock
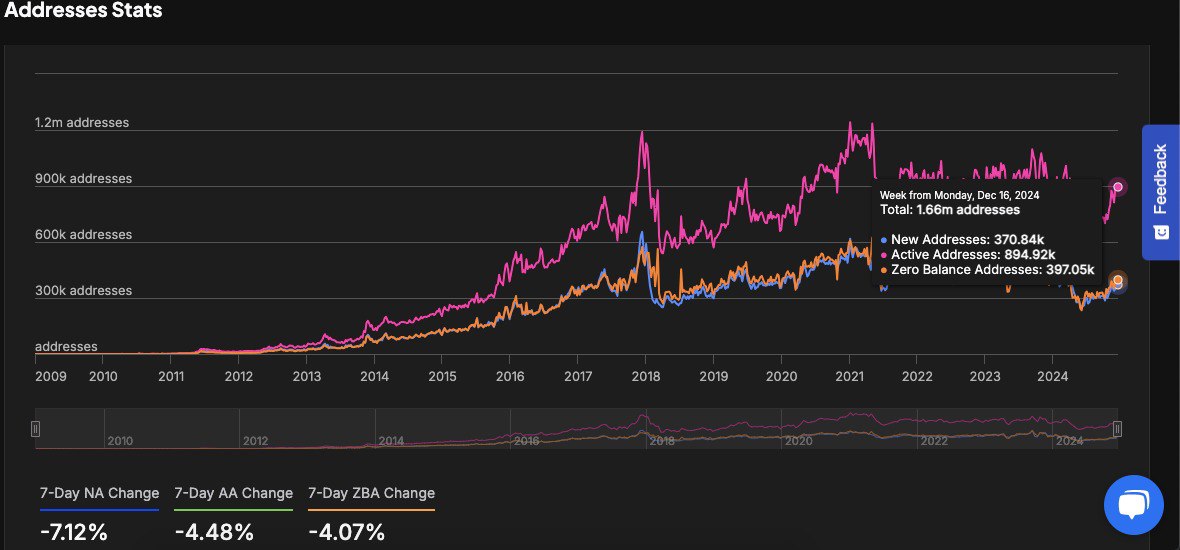
Address activity also shows a mixed trend. There are currently 1.66 million addresses, including 370,840 new and 894,920 active addresses.
However, this past week saw a 7.12% decline in new addresses and a 4.48% decline in active addresses, indicating a possible slowdown in retailer participation during the recent market correction.

Source: IntoTheBlock
Technical indicators point to a short-term correction
Technical analysis of Bitcoin shows it trading above the 9 and 21 day moving averages. This indicates an overall bullish trend since October.
However, the recent MACD crossover shows that the MACD line falls below the signal line. The histogram turning red indicates a weakening of bullish momentum.
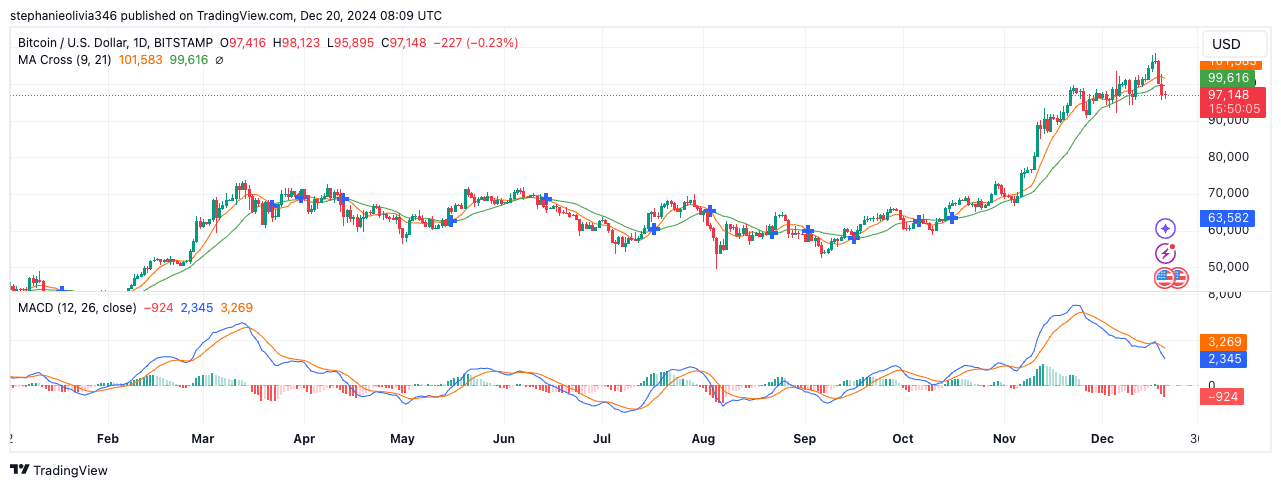

Source: TradingView
Read Bitcoin’s [BTC] Price forecast 2024-25
The current resistance at $99,644 has led to a slight pullback, suggesting the possibility of consolidation or further correction.
Analysts recommend monitoring the support at $95,000 to gauge whether the uptrend will continue or further declines await.


