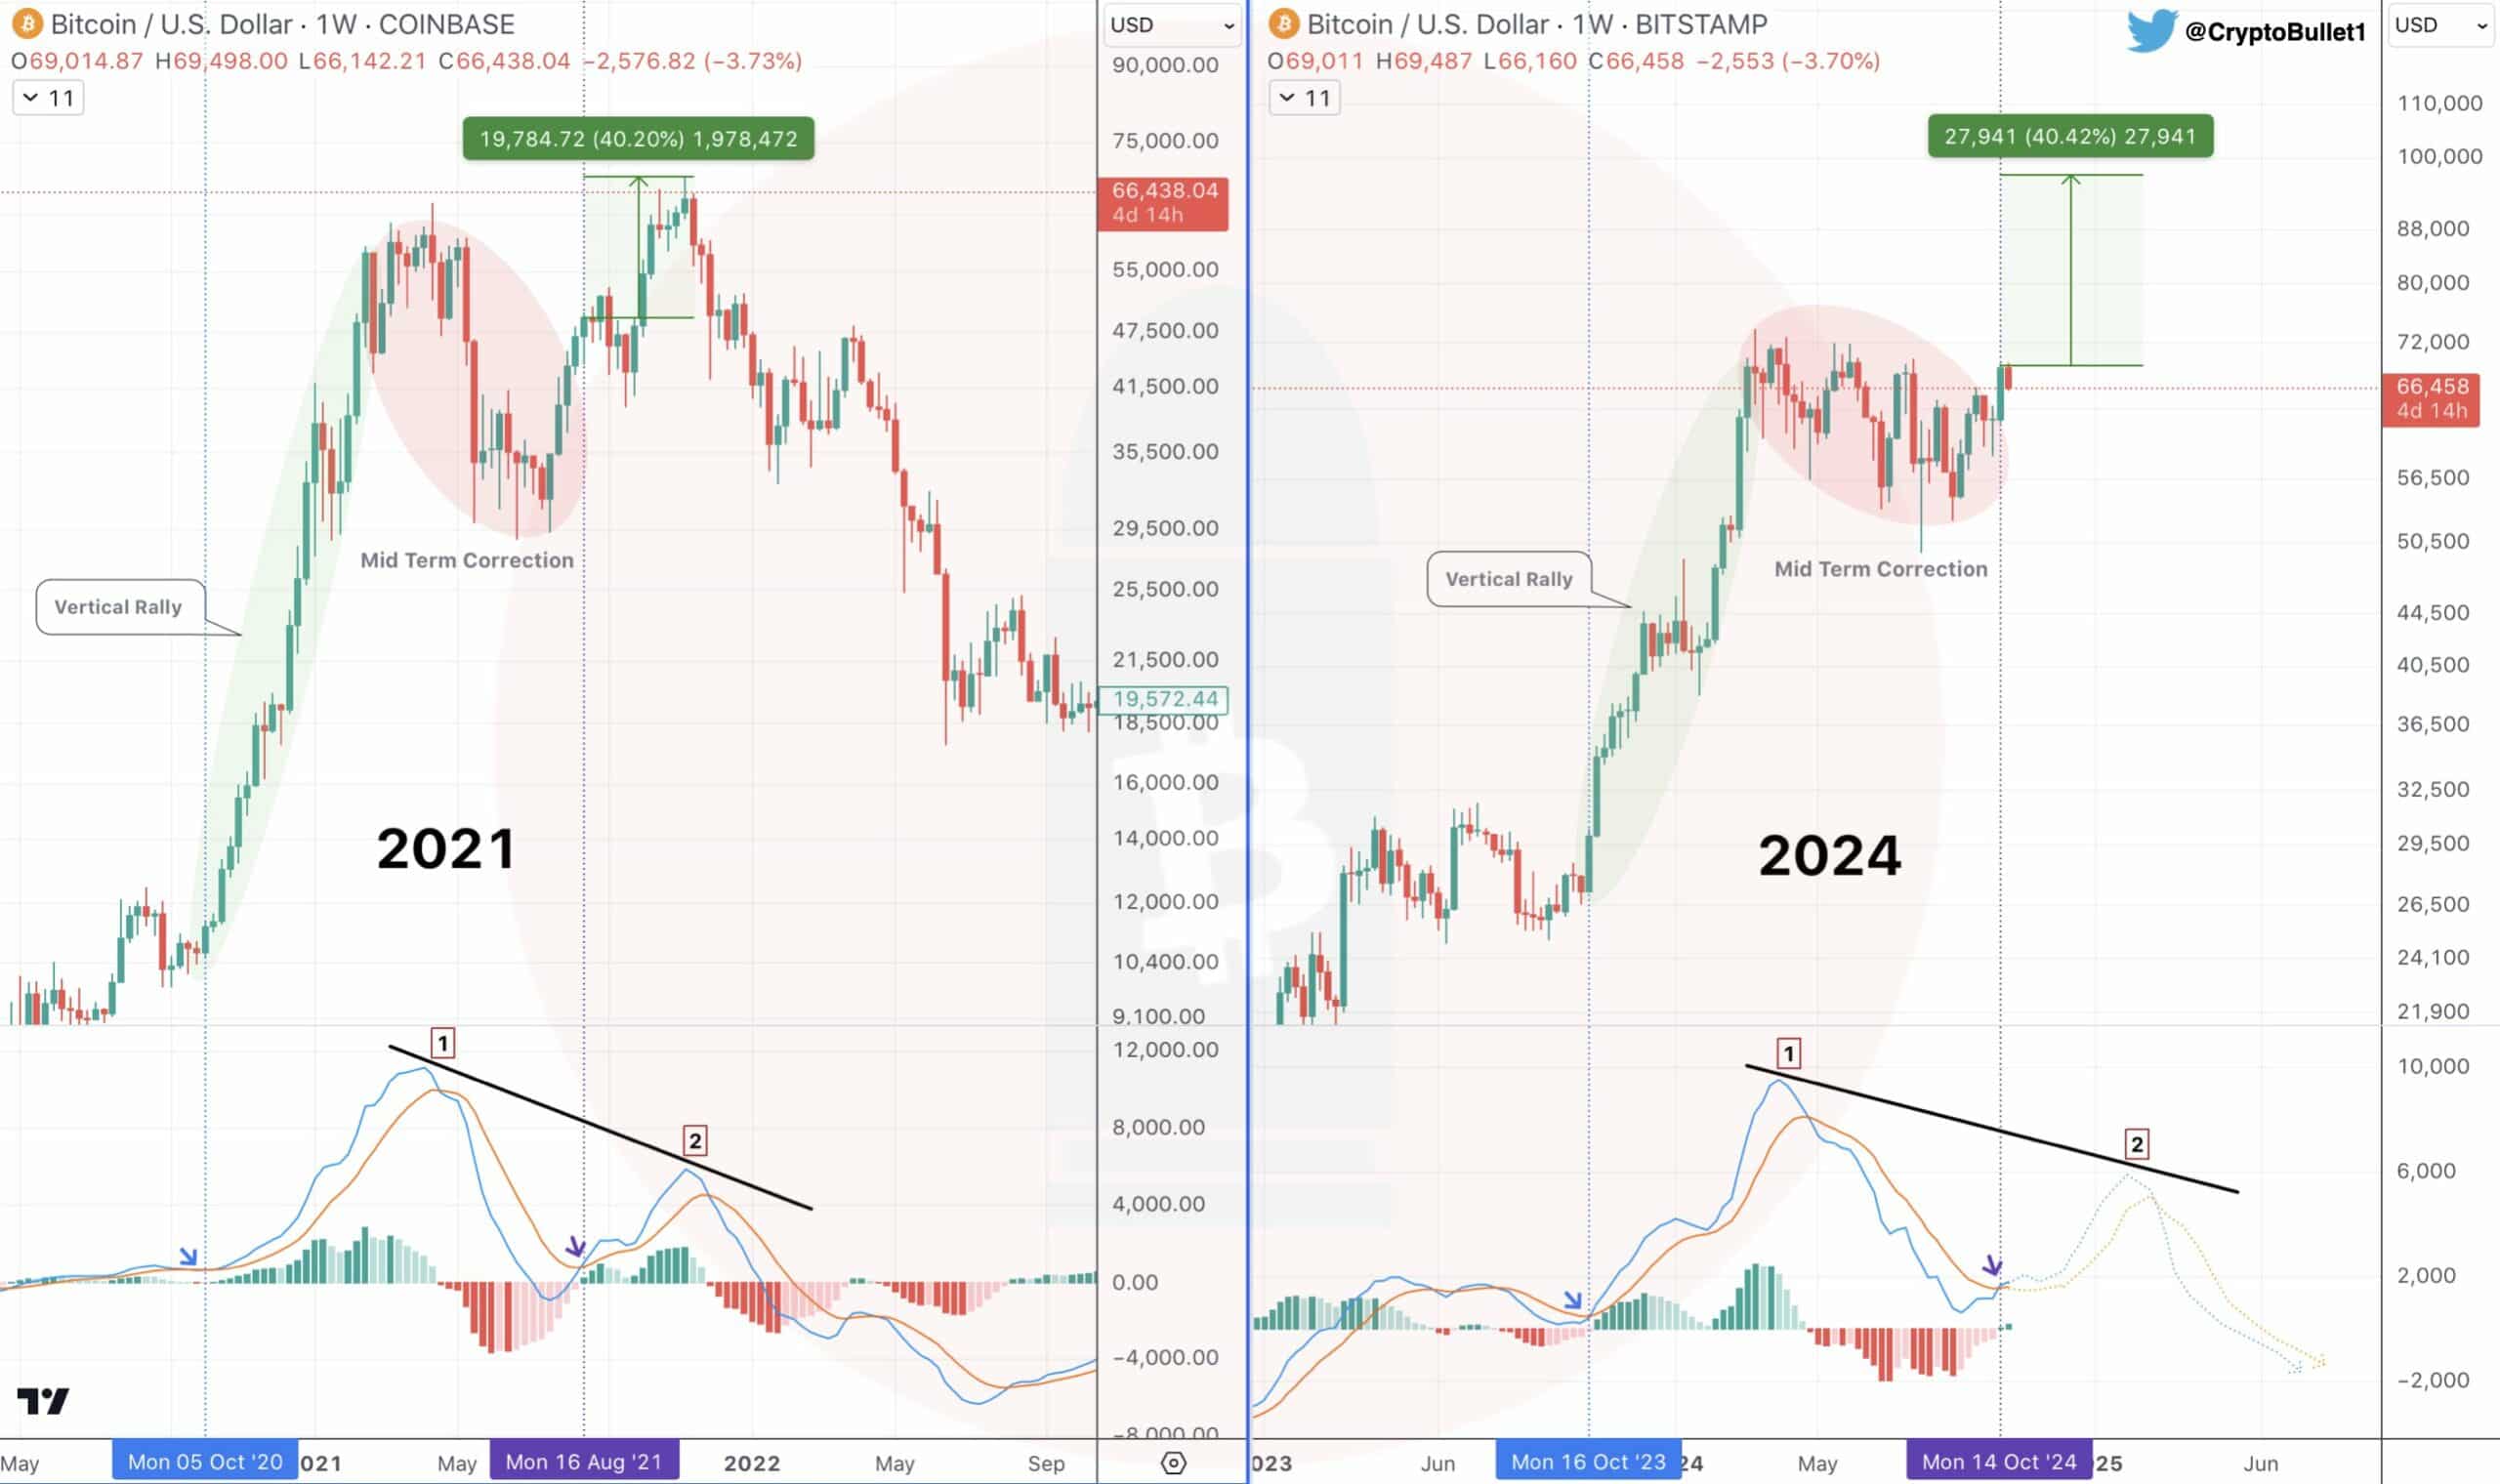
- Analysts predict a 40% rally for Bitcoin before the cycle top.
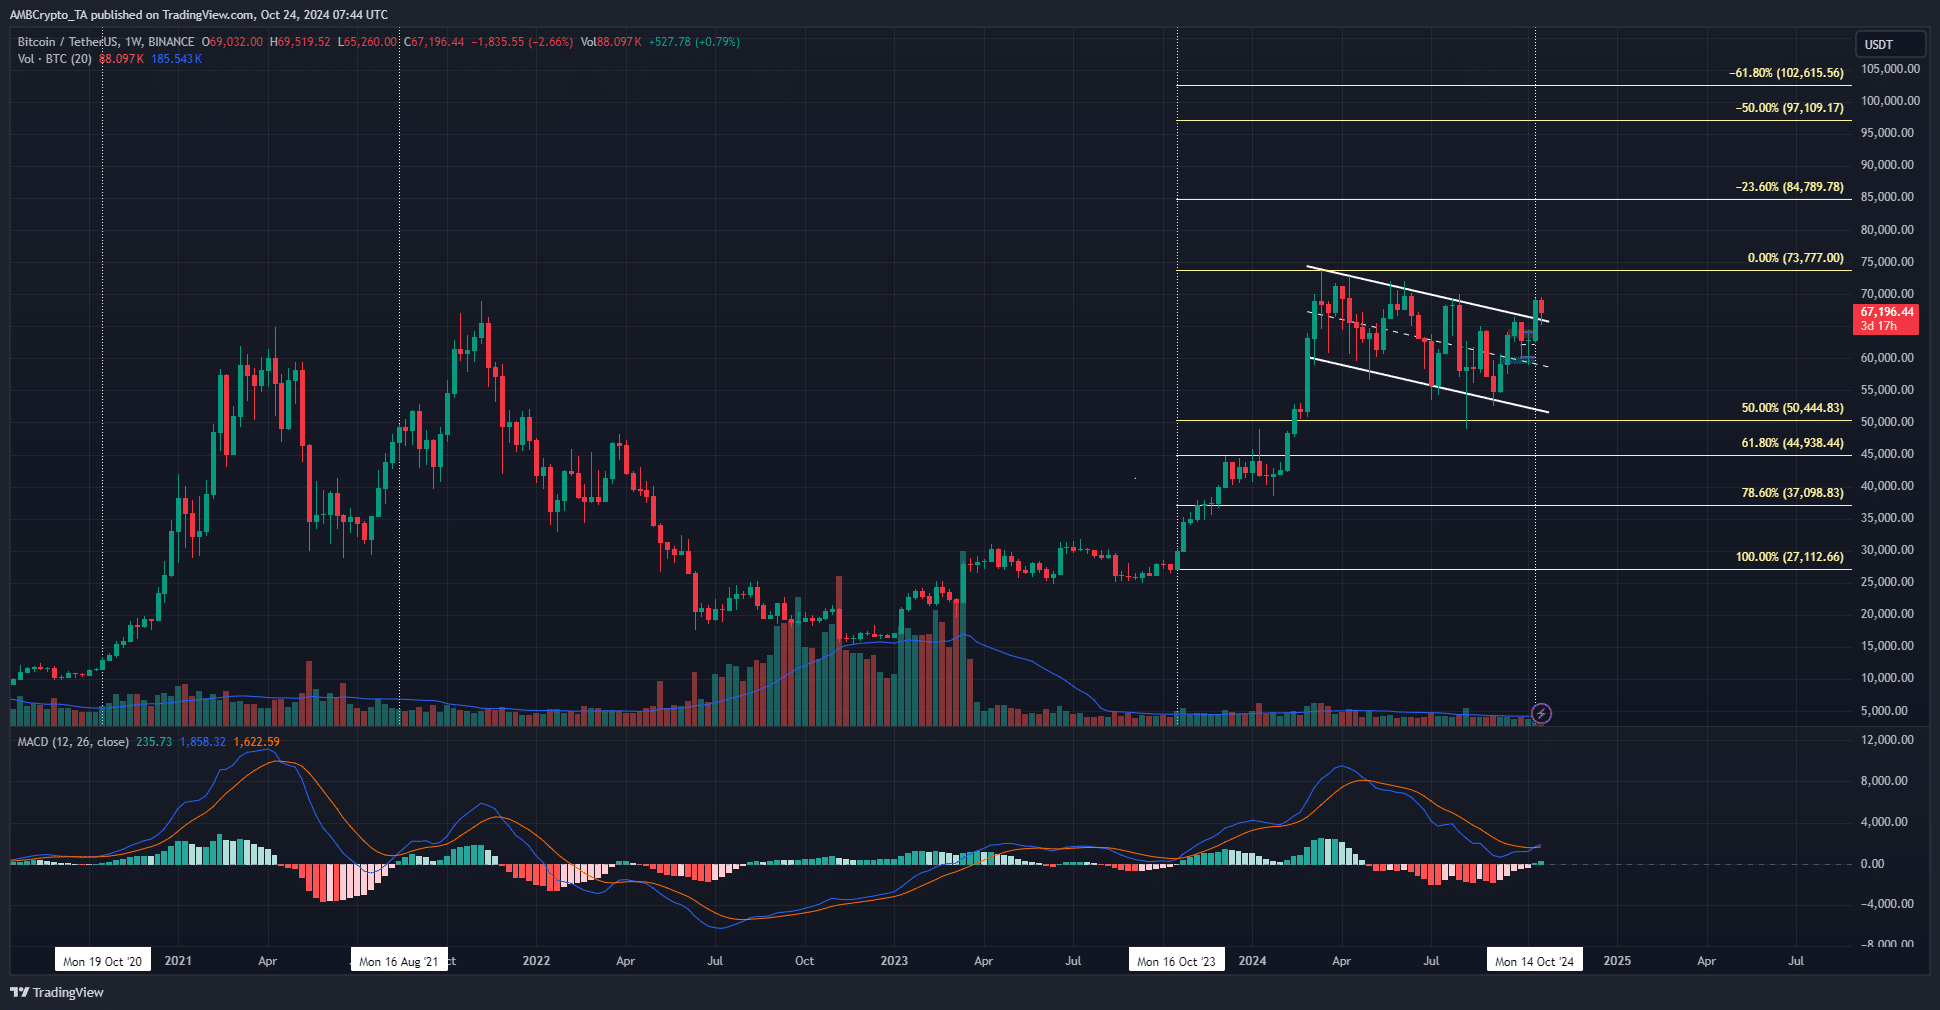
- The Fibonacci extension levels show targets of $109,000 and $132,000.
Bitcoin [BTC] saw an increase in the number of addresses collected. The HODL mentality became increasingly popular. Bitcoin addresses that have never had an outflow and at least 10 BTC had 1.5 million coins in early 2024, but currently 2.9 million.
The Bitcoin Rainbow Chart gave ultra-optimistic predictions for the current cycle, with a target of $288,000 or higher. However, historical trends showed that a cycle top this time could be closer to $100,000.
Bitcoin ready for another 40% rally before cycle top?
In one message on Xcrypto analyst CryptoBullet noted that the weekly MACD formed a bullish crossover for the first time since October 2023. At the time, a 172% rally occurred within five months.
Yet this rally occurred before Bitcoin’s halving. The debate now is: should we expect similar gains, or would the next leg higher ultimately form a lower high on the MACD, ultimately marking the end of the bull run?
The analyst favored the latter scenario. A multi-month consolidation followed by a bullish MACD crossover after a vertical rally would likely not produce a triple-digit percentage gain. CryptoBullet suggested in its charts that another 40% increase would be a reasonable target.
Measuring the current targets for Bitcoin


Source: BTC/USDT on TradingView
History rhymes, but it doesn’t have to repeat itself. During the 2017-2018 bull run, the MACD’s weekly bullish crossover saw a 617% return, and 2020’s saw a 468% move. The 2023 version returned 172%, but occurred before the halving date.
Is your portfolio green? Check the Bitcoin Profit Calculator
In 2019 and 2020, Bitcoin rose 190% from the low of $3.2k 18 months before the halving. It is possible that the pre-halving run that BTC saw could be broken, and the 40% price increase target that CryptoBullet gave for the next leg could be wrong.
However, as things stand now, it seems like a reasonable expectation. It also lines up well with the Fibonacci extension levels plotted in the weekly chart above.
Disclaimer: The information presented does not constitute financial advice, investment advice, trading advice or any other form of advice and is solely the opinion of the writer


