

- ETH is up 4.36% over the past month.
- Ethereum experienced upside momentum, indicating more gains if the $2264 support holds.
Since hitting a local low of $2309, Ethereum [ETH] has seen a strong upward movement. So recent gains have exceeded losses, turning October green.
In fact, at the time of writing, Ethereum was trading at $2525. This represented an increase of 2.44% compared to the previous day. Similarly, ETH is up 4.36% on the monthly charts, extending the bullish trend with an increase of 1.53% on the weekly charts.
Looking further, the altcoin has seen a flurry of trading activity. As such, trading volume increased by 35.51% to $12.43 billion.
As expected, these market conditions have crypto analysts talking about the altcoin’s trajectory. One of them is the popular crypto analyst Bitcoin guy which has suggested that the current bullish scenario holds if ETH remains above $2264.
Market sentiment
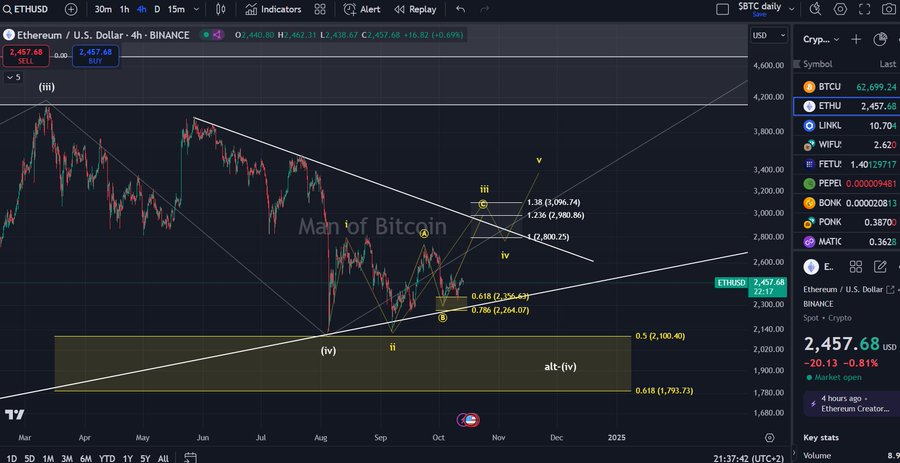
In the analysis, Man of Bitcoin stated that ETH is moving sideways, implying that it is in a consolidation range.
Source:
According to him, the current movements on the price charts show weakness, indicating a potential downside.
Therefore, the analysts claim that the identified bullish scenario is only valid as long as ETH trades above $2264.
With the altcoin holding this level, the potential next move, using the Elliot wave analysis, is Wave -C of iii at $3096. This implies that the price range is within the third wave, which is the strongest and offers the potential for further gains.
However, if the altcoin fails to hold this level and experiences a disruption, it means Wave -iv is moving downward.
What ETH charts say…
Man of Bitcoin’s analysis undoubtedly offers a cautious future perspective. However, it is essential to counterbalance and determine what other market indicators imply.
Source: Coinglass
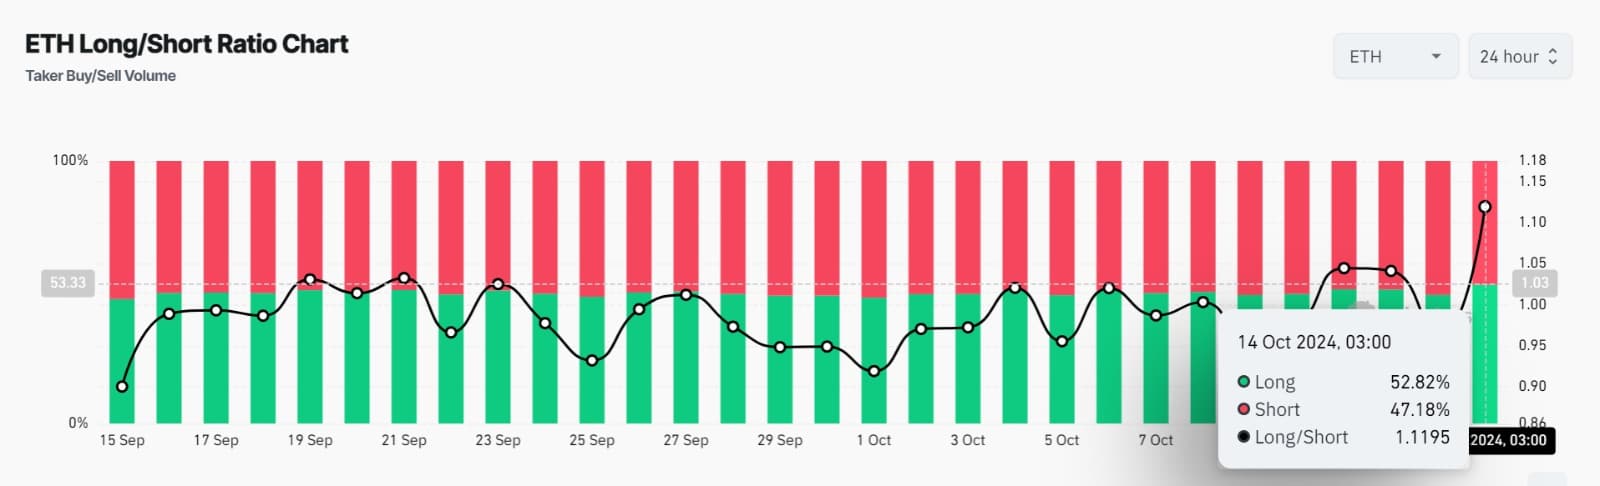
For example, Ethereum’s Long/Short ratio has remained above over the past 24 hours. At the time of writing, ETH’s long/short ratio was 1.1195, signaling increased demand for long positions.
As such, long position holders dominate the market as they continue to open new trades.
Source: Cryptoquant
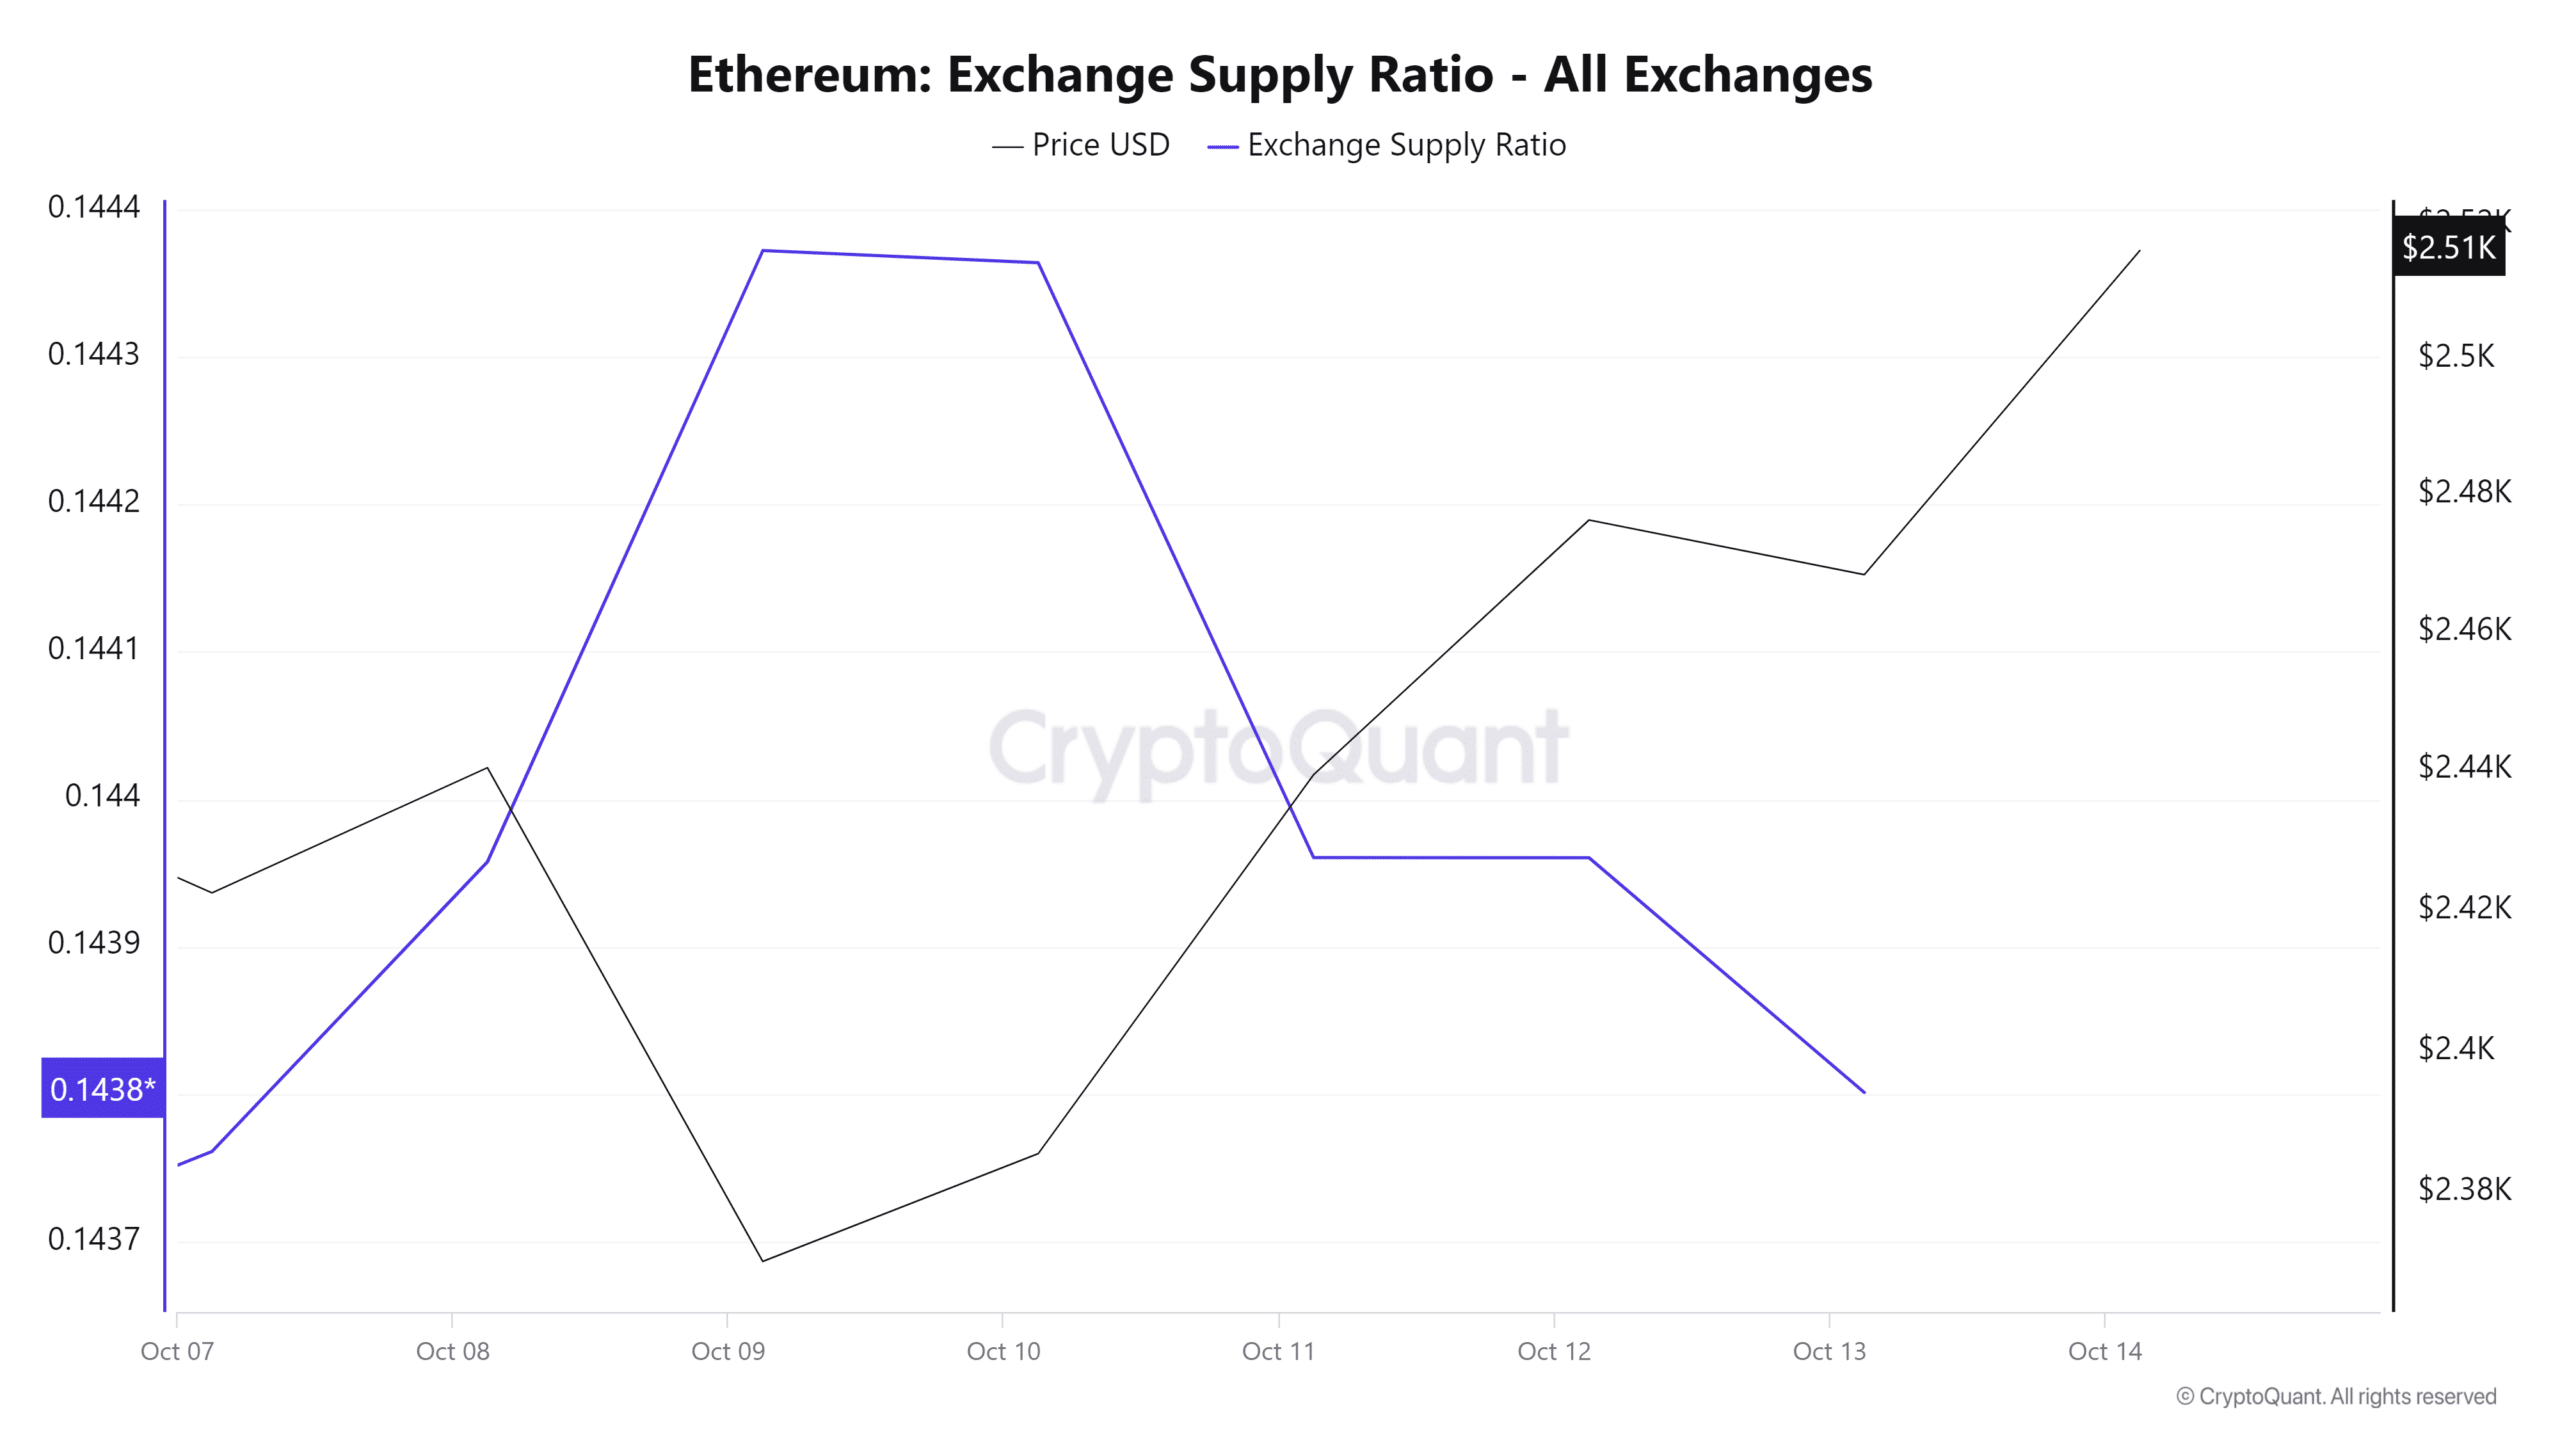
Moreover, Ethereum’s supply exchange ratio has experienced a sustained decline over the past five days. Decreasing supply on the exchange implies that investors are choosing to hold on to their ETH. This usually reduces the number of tokens in the supply, resulting in a supply squeeze.
Source: Cryptoquant
Read Ethereum’s [ETH] Price forecast 2024–2025
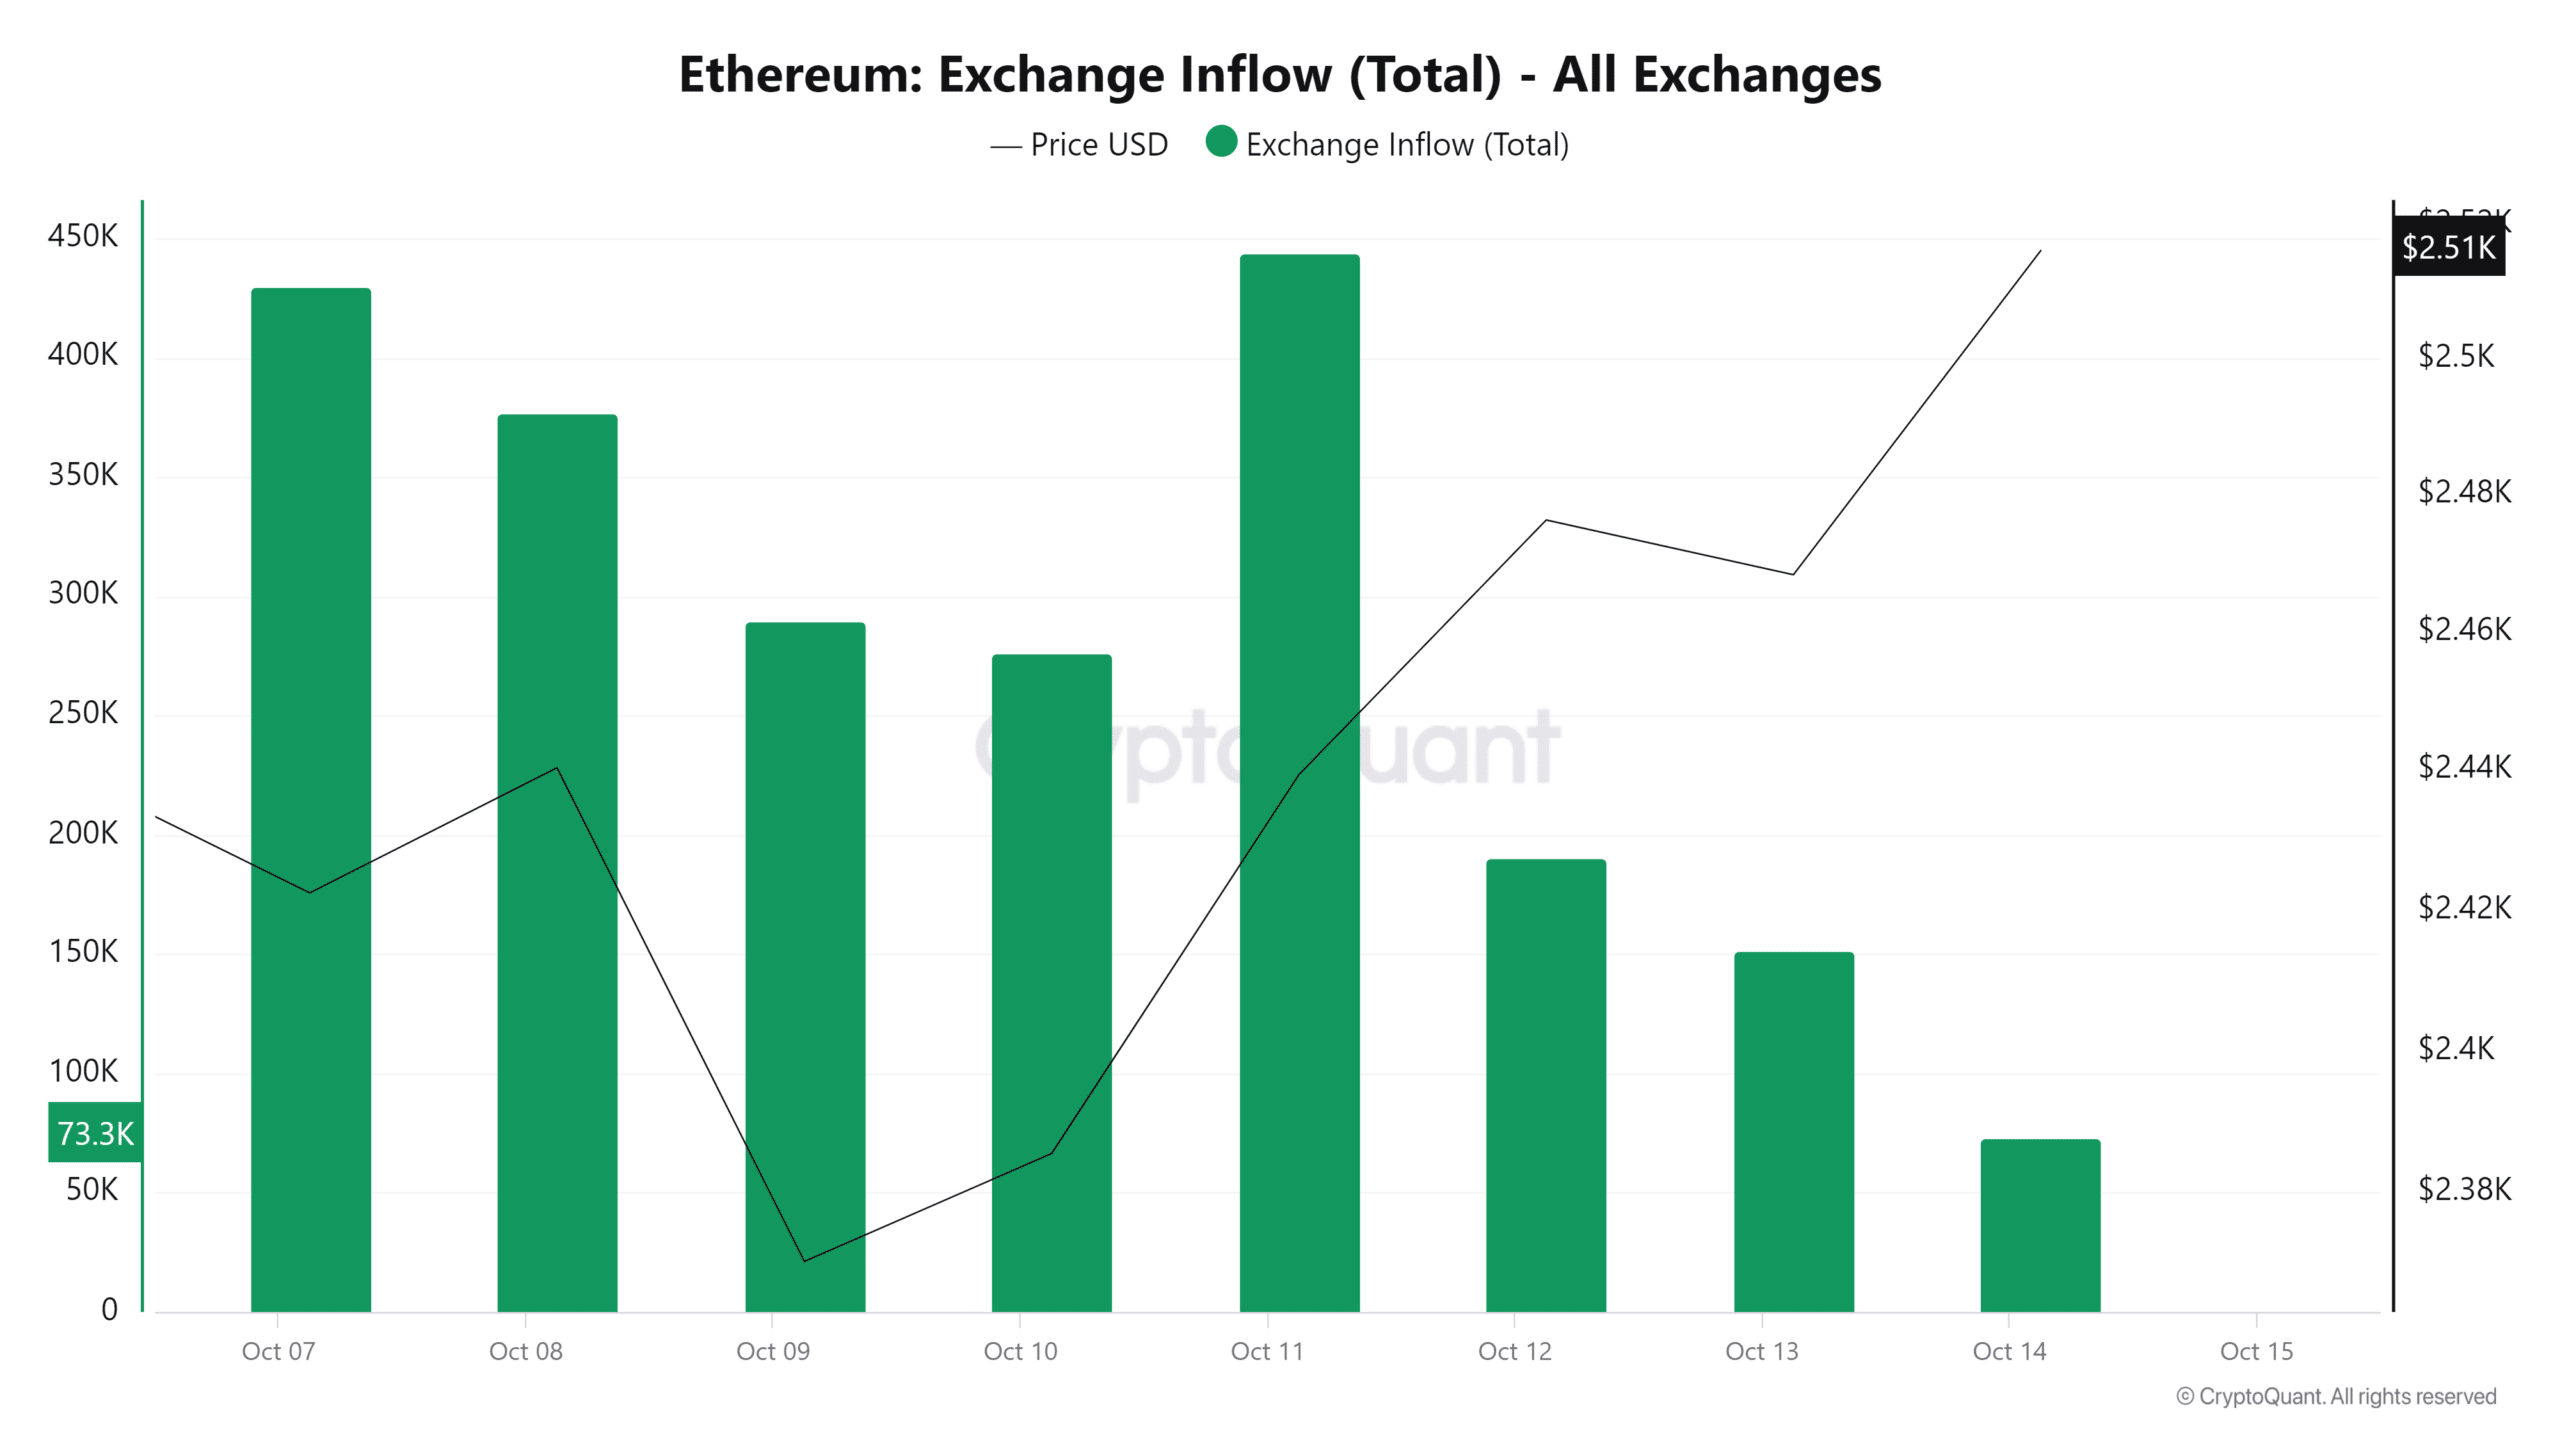
Finally, ETH exchange inflows have declined over the past four days, indicating a shift in market sentiment toward holding, as illustrated by a decline in the supply exchange ratio.
Simply put, ETH is in a bullish phase, and as the analyst previously noted, this is valid as long as the $2264 support holds. Therefore, with positive market sentiment and investor preference, ETH will attempt a resistance level at $2727 in the near term.