- Chainlink showed signs of a bullish reversal despite being below the major moving averages.
- The formation of an inverse head-and-shoulders pattern indicated increasing interest from traders.
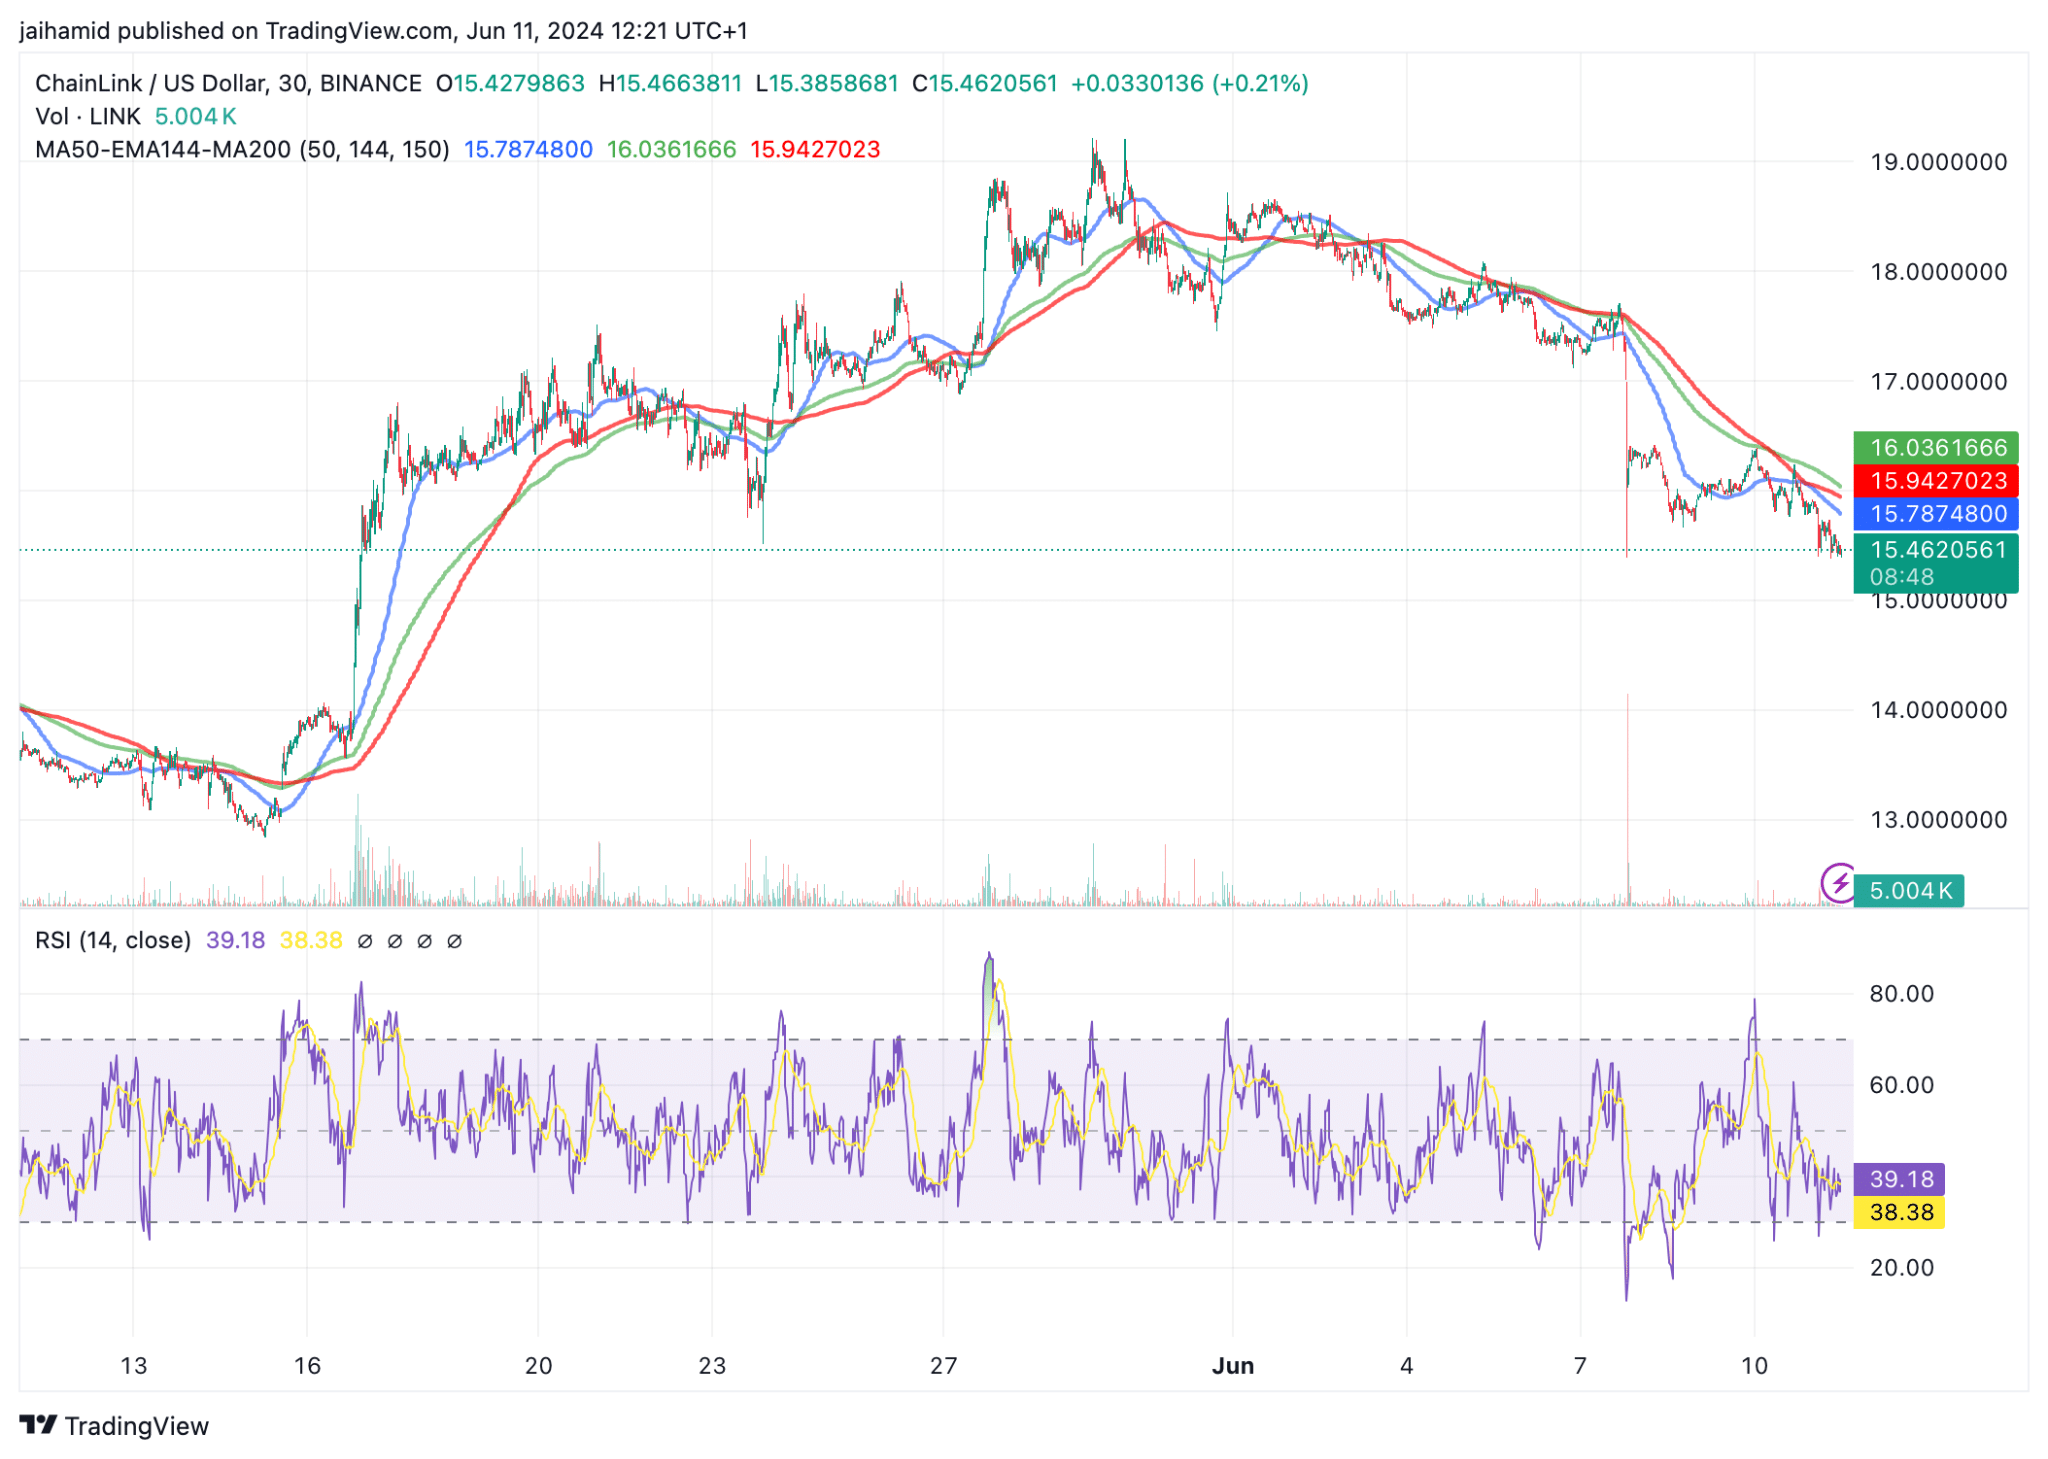
After two weeks of dormant performance by Chainlink [LINK]the altcoin appears to be starting to form a bullish reversal pattern, indicative of a potential rally.
LINK’s price at the time of writing was below all three major moving averages: the 50-day MA (blue line), the 144-day EMA (green line), and the 200-day MA (red line). This usually indicates a bearish trend.


Source: TradingView
The RSI is around 39.54, which is below neutral 50, but above oversold territory.
Given the recurrence of the inverse head-and-shoulders patterns and their positions relative to the moving averages, LINK appears to be attempting to recover from the previous downtrends.
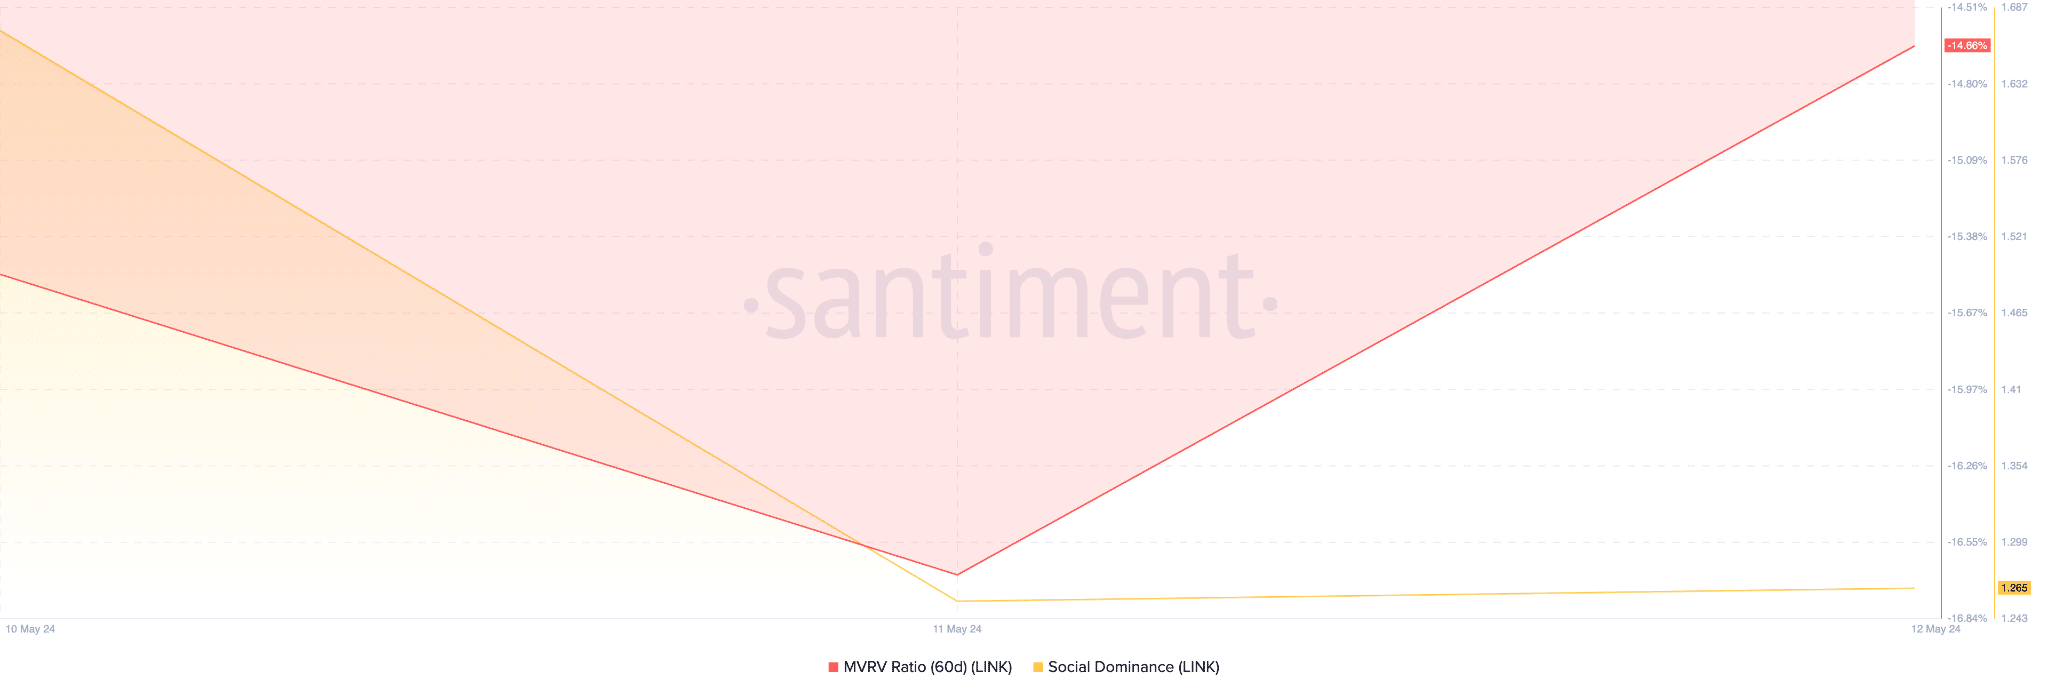
The downward trend in the MVRV ratio, which is currently approaching -16.84%, indicates that most holders who bought or moved LINK in the last two months have incurred losses.


Source: Santiment
Typically, a lower MVRV ratio can indicate that a token is undervalued, which could indicate a potential buying opportunity if investors believe the price will rise quickly.
And LINK may not dominate social media conversations, but it is a consistent presence.
LINK derivatives trading volume has increased by 85.94%, indicating a high level of activity and strong interest from traders ahead of the bullish reversal.
As evidenced by the Long/Short ratio of 0.9257, the overall market sentiment points to an almost balanced view among traders, although slightly tilted towards bullishness.


Source: Coinglass
Read the one from Chainlink [LINK] Price forecast 2024-25
Given the current situation and recent market behavior, Chainlink appears to be on the verge of a bullish reversal.
If the bullish sentiment is evident from high long positions on platforms such as Binance [BNB] and OKX holds, we could see a continued or amplified recovery in Chainlink’s price.

