

Dogecoin is moving higher above the resistance zone at $0.160 against the US dollar. DOGE holds gains and could aim for a move above $0.1650.
- DOGE price is moving higher above the USD 0.160 resistance zone.
- The price is trading above the USD 0.160 level and the 100-hour simple moving average.
- A major bullish trendline is forming with support near $0.160 on the hourly chart of the DOGE/USD pair (Kraken data source).
- The price needs to break above $0.1650 to gain bullish momentum and continue higher.
Dogecoin price holds support
Over the past few sessions, Dogecoin price started a steady rise above the $0.1500 zone, like Bitcoin and Ethereum. DOGE bulls were able to push the price above the USD 0.160 resistance zone.
The recent swing high was formed at $0.1646 before the price started a downward correction. There was a decline below the $0.1620 support zone. The price peaked below the 23.6% Fib retracement level of the upward move from the $0.1571 swing low to the $0.1646 high.
Dogecoin is now trading above the $0.160 level and the 100-hourly moving average. There is also a major bullish trendline forming with support near $0.160 on the hourly chart of the DOGE/USD pair.
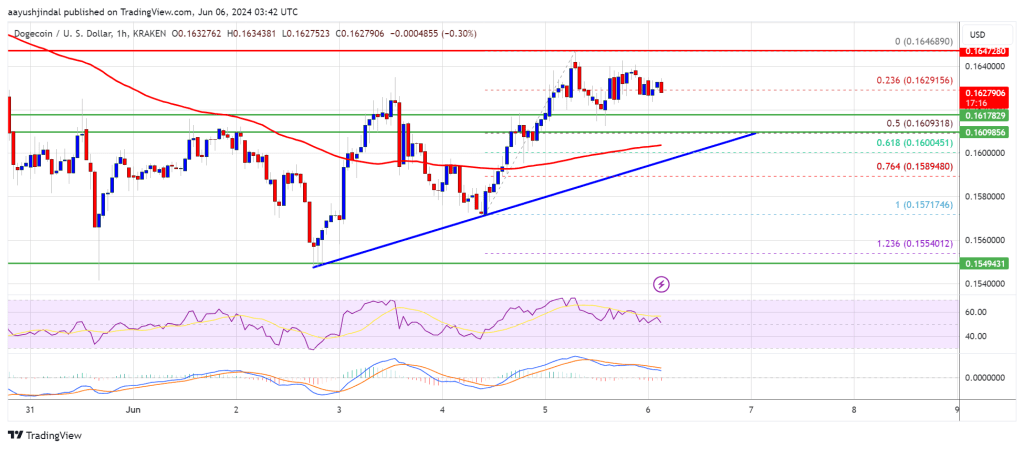
On the upside, the price is facing resistance around the $0.1640 level. The next major resistance is near the $0.1650 level. A close above the resistance at $0.1650 could send the price towards the resistance at $0.1720. Any further gains could send the price towards the USD 0.1750 level. The next big stop for the bulls could be $0.1800.
Disadvantage correction in DOGE?
If DOGE price fails to rise above the USD 0.1650 level, it could trigger another decline. The initial downside support is near the $0.160 level and the trendline. It is close to the 50% Fib retracement level of the upward move from the $0.1571 swing low to the $0.1646 high.
The next major support is near the $0.1580 level. If there is a downside break below the USD 0.1580 support, the price could fall further. In the mentioned case, the price could drop to the $0.1520 level.
Technical indicators
Hourly MACD – The MACD for DOGE/USD is now losing momentum in the bullish zone.
Hourly RSI (Relative Strength Index) – The RSI for DOGE/USD is now above the 50 level.
Major support levels – $0.1620, $0.1600 and $0.1580.
Major resistance levels – $0.1640, $0.1650 and $0.1720.