

Crypto sentiment has fallen to what CryptoinsightUk founder Will Taylor describes as “historic lows,” and the damage is starting to show in higher timeframe indicators that rarely blink. In a February 14 weekly note, Taylor argued that the setup is shifting from a “collapse” to a late-stage price decline, and pointed out that XRP is priced in gold as one of the cleanest clues.
Taylor described the week as “another painful week in crypto,” but said the timing of the pessimism matters. On Bitcoin’s weekly chart, he wrote, BTC has “reached the oversold level for only the third time in recent history,” adding that the two previous events marked the bear market low or “very close.” According to him, the extreme sentiment, combined with a statistically rare signal, tends towards exhaustion rather than a new downward acceleration.
The core of Taylor’s argument rests on positioning for an expansion of volatility in Bitcoin dominance. He said the Bollinger Bands are “extremely compressed” in terms of dominance, a configuration he considers unstable: “Compression leads to expansion. And expansion leads to volatility. Simply put, volatility is inbound.”
Related reading
Direction is the debate. Taylor’s base case is a downward break in dominance – ultimately below 36% – which, if combined with a resilient or rising Bitcoin price, would imply not only new money coming into crypto, but also a rotation across the risk curve. He cited an earlier episode as an example: In November 2024, when dominance fell by about 10 percentage points, “XRP saw a subsequent move of about 490%,” which he characterized as “a vertical expansion.”
To confirm the rotation setup, Taylor pointed to the OTHERS/BTC ratio: the market outside the top 10 against Bitcoin. On the monthly time frame, he said the RSI “just crossed bullish” and the chart is “about to print a second green monthly MACD volume candle,” after what he described as a bullish cross near the lows. The combined picture, he argued, is alignment: altcoins are starting to regain their relative strength as the volatility of dominance decreases.
XRP vs. Gold: A “Historic Zone” Setup
Taylor’s more specific claim focused on XRP priced in gold, a combination he said is largely ignored despite being structurally informative. “If you look at the price of XRP versus gold, you will notice that we have retreated into an extremely strong historical support region,” he wrote. “At the same time, the monthly RSI has reached levels that we have only seen once before, and that was just before the parabolic expansion of 2017.”
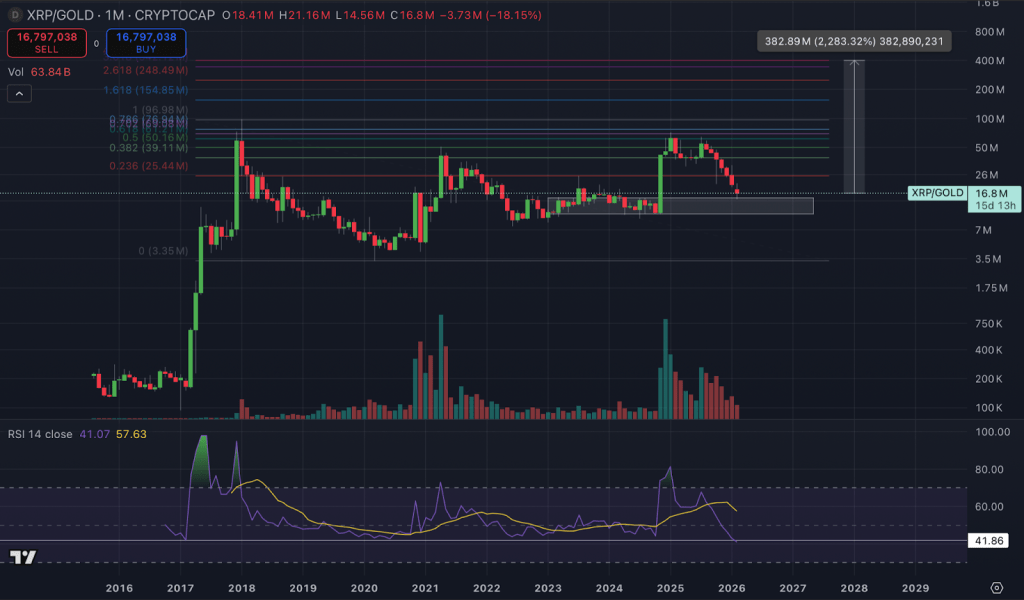
From there, Taylor laid out a scenario rather than a prediction: If XRP holds that support and completes what he called a 4.236 Fibonacci extension “from this structure,” the move could be “about 20x versus gold.” He emphasized the usual caveat that relative performance does not clearly align with the dollar pair. “That doesn’t automatically mean 20x against the dollar,” he wrote, noting that gold itself could weaken and that “macro conditions could change.”
Related reading
Still, he argued that the relative signal is the point. In his framework, sustained outperformance against gold indicates that capital is “aggressively turning to risk,” a backdrop in which altcoins tend to lead the way.
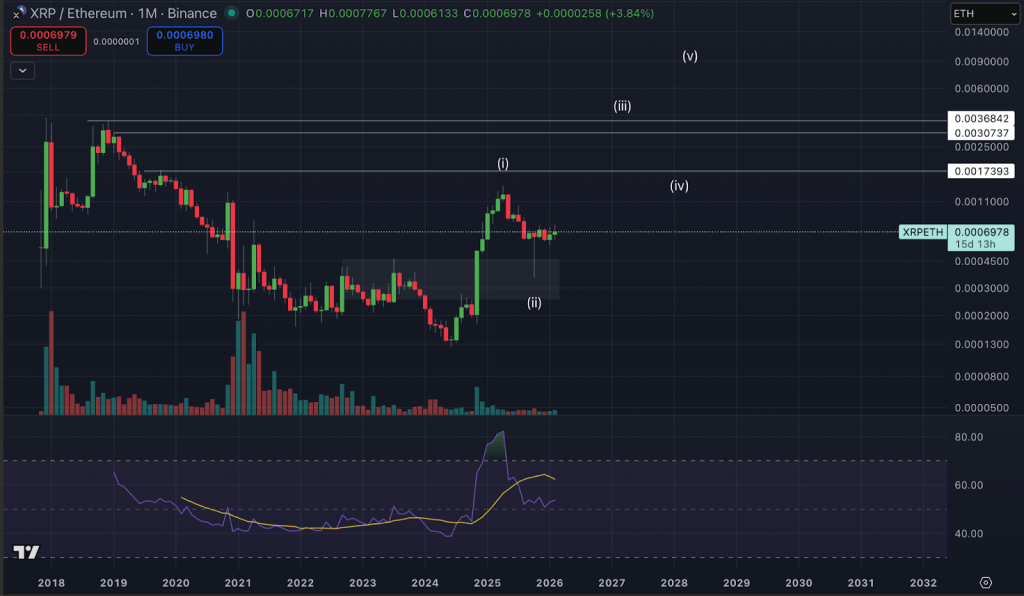
Taylor added a second relative strength angle: XRP versus Ethereum. He put forward an Elliott Wave interpretation in which XRP has completed wave one and wave two against ETH, creating a potential wave three: “typically the most aggressive, most explosive leg.” While he called Elliott Wave “a framework, not a certainty,” he highlighted a momentum detail: a monthly RSI staying above 50 through consolidation, which he said is consistent with continuation rather than a collapse.
At the time of writing, XRP was trading at $
Featured image created with DALL.E, chart from TradingView.com