

In recent trading activity, XRP has taken a significant hit in its latest attempt to recover to its previous high of $0.6360. Despite the initial bullish momentum suggesting a possible breakout, XRP was unable to sustain its upward trajectory. The inability to achieve the expected target has led to a notable decline in value, raising concerns among traders and analysts about the short-term prospects for XRP.
As XRP struggles with these hurdles, this article attempts to analyze the current price movement and the technical indicators that point to a continued decline. The goal is to give readers a comprehensive insight into the token’s potential future trajectory.
XRP was trading at $0.5974 at the time of writing, indicating a gain of 1.13%. The cryptocurrency has amassed a trading volume of over $2 billion and a market capitalization of over $33 billion. Over the past day, XRP trading volume has increased by 41.17%, while its market cap has increased by 1.13%.
The initial bullish momentum is faltering
Although XRP is still actively trading above the 100-day Simple Moving Average (SMA) on the 4-hour chart, the price is currently in a bearish move towards $0.5725 after failing to sustain its upward trajectory. If the digital asset continues its current bearish trend, it could fall below the $0.5725 mark.
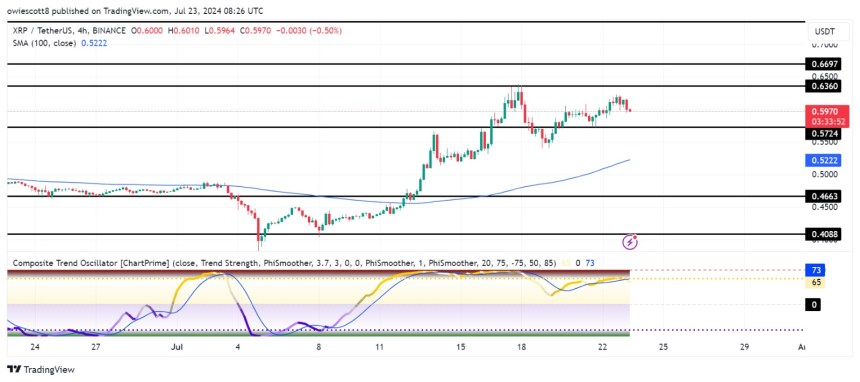
The 4-hour Composite Trend Oscillator indicates that XRP could continue its bearish trajectory towards $0.5725 as the signal line is currently attempting to dip below the indicator’s SMA. If the signal line crosses below the SMA, both lines will likely move towards the zero line, indicating a possible long-term decline for the coin.
On the 1-day chart, following XRP’s inability to maintain its upward trajectory towards the previous high of $0.6360, the price is currently attempting a single-candle bearish move towards $0.5725, with the price trading above -day SMA trades. This bearish momentum could push the digital asset to the $0.5725 mark.
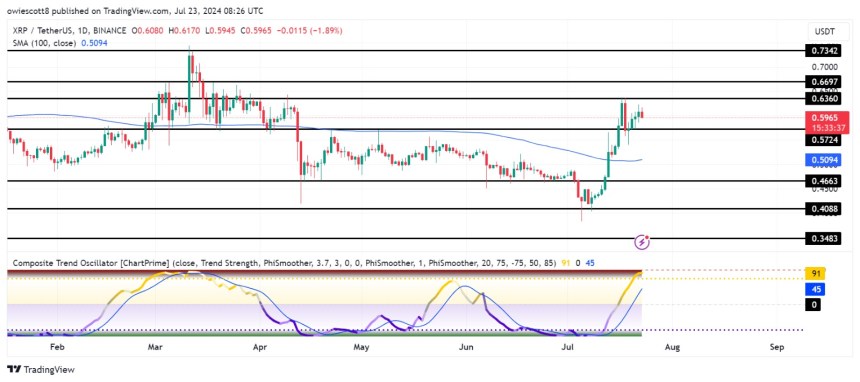
Finally, it can be noted that the signal line is currently trading in the overbought zone and is trying to move down towards the SMA of the indicator. This formation in the compound trend oscillator suggests that the price of XRP could continue its bearish move towards $0.5725 before potentially moving back up.
Expert insights on crucial XRP levels to monitor
Should the price of A successful break above this target could potentially trigger further upside to test the resistance at $0.6697 and beyond.
Nevertheless, if the price of A further break below the $0.4663 support level could lead to a price decline towards the $0.4088 support level and other lower levels.