

XRP’s recent price action in 2025 was more of a dynamic move than a simple sideways move. After a strong rally earlier in 2025 and reaching new all-time highs, the cryptocurrency has spent much of the past few months digesting those profits through withdrawals and consolidations.
That structure was referenced in a chart shared by Steph on social media platform
Related reading
XRP completes nearly 400 days of sideways accumulation
According to to Steph’s analysis, XRP has just completed roughly 393 days of sideways accumulation, a duration that almost perfectly matches the 395-day consolidation phase it went through between 2016 and 2017.
During that earlier cycle, XRP continued to move within a relative range for months, causing choppy price action. This type of extensive consolidation reflects an equilibrium between buyers and sellers, with neither side being strong enough to force a decisive trend.
In 2017, that equilibrium led to a transition to a different technical formation of a descending channel before it broke out. The current setup in 2024-2025 shows, at least structurally, that XRP is once again spending an unusually long time building a base in a range. A more detailed look at the graph shows another important similarity with the transition to another descending channel.
In the 2016-2017 cycle, XRP transitioned from a sideways move to a descending channel, causing its price to gradually decline over several months. That downward-sloping structure was eventually resolved with a sharp upward break.
The 2024-2025 chart shows XRP moving through a similar descending channel, with the price compressing towards the lower limit before shows early signs of an outbreak while attention is still low.
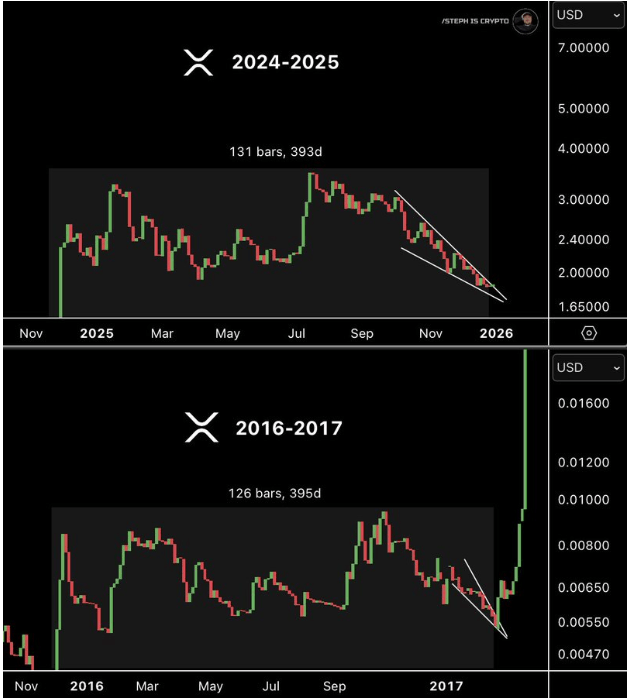
XRP price comparison. Source: @Steph_iscrypto on X
What to expect for XRP
The 2016-2017 chart segment above shows XRP trading for approximately 395 days in a wide sideways range between approximately $0.005 and $0.01. When XRP broke out of the declining channel in early 2017, its price rose very quickly, first recovering $0.01 and then rising past $0.03 and $0.05 within a few days. The expansion didn’t stop there, as XRP eventually rose to the $0.40 region later that year, cementing XRP’s first 5,000% move in its history.
The 2024-2025 chart shows XRP peaking near the $3.40 zone before entering a sideways consolidation phase in 2025. The price action is now in the descending channel viz gradually compressed the $1.70-$1.90 range.
Related reading
That channel now resembles where XRP was in 2017 before the breakout, adjusted for scale. A similar 5,000% move from the current price action zone would mathematically project the XRP price to about $100.
Featured image from Unsplash, chart from TradingView