

Ripple’s token price corrects gains of $0.550 against the US dollar. The XRP price could trigger another bullish wave unless there is a close below $0.50.
- Ripple’s token price is correcting gains from the 0.550 resistance against the US dollar.
- The price is now trading above USD 0.505 and the 100 simple moving average (4 hours).
- A major bullish trendline is forming with support near $0.504 on the 4-hour chart of the XRP/USD pair (Kraken data source).
- The pair could start a new increase if it remains above the $0.500 and $0.490 support levels.
Ripple’s token price provides important support
In the last XRP price prediction, we discussed quite an increase against the US dollar. The price remained well above the $0.520 level and continued to climb higher, along with Bitcoin and Ethereum.
The price surpassed the USD 0.532 resistance and tested USD 0.550. A high was formed near $0.5493 and the price underwent a downward correction. There was a move below USD 0.532 and USD 0.525. There was a break below the 50% Fib retracement level of the upward move from the $0.4907 swing low to the $0.5493 high.
However, XRP is still trading above $0.505 and the 100 simple moving average (4 hours). Furthermore, a major bullish trendline is forming with support near $0.504 on the 4-hour chart of the XRP/USD pair.
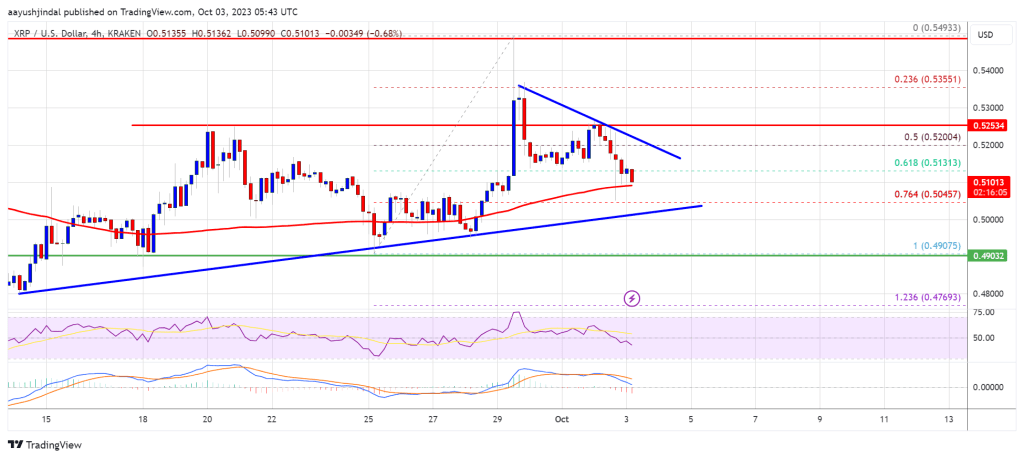
Source: XRPUSD on TradingView.com
On the upside, immediate resistance is around the $0.515 level. Moreover, there is a connecting bearish trendline at $0.520. A close above the $0.520 level could send the price towards the $0.532 barrier. A successful break above the USD 0.532 resistance level could trigger a strong rise towards the USD 0.550 resistance level. Any further gains could send XRP towards the USD 0.580 resistance.
More losses in XRP?
If the ripple fails to break the USD 0.532 resistance zone, it may continue to decline. Initial downside support is near the $0.5065 zone and the 100 simple moving average (4 hours).
The next major support is at $0.500. If there is a downside break and a close below the USD 0.500 level, the price of XRP could extend losses. In the said case, the price could retest the USD 0.475 support zone.
Technical indicators
4-hour MACD – The MACD for XRP/USD is now losing pace in the bullish zone.
4-hour RSI (Relative Strength Index) – The RSI for XRP/USD is now below the 50 level.
Major support levels – $0.505, $0.500 and $0.490.
Major resistance levels – $0.520, $0.532 and $0.550.