Ripple’s token price is rebounding higher at $0.458 against the US dollar. XRP price could start a new rally if it crosses the USD 0.505 and USD 0.515 resistance levels.
- Ripple’s token price is trying to make a move above $0.510 and $0.525 against the US dollar.
- The price is now trading below $0.505 and the 100 simple moving average (4 hours).
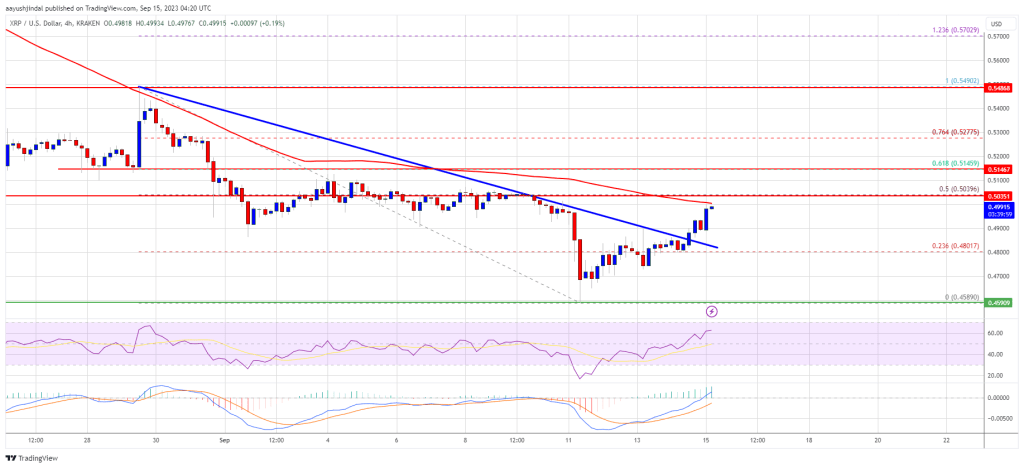
- There was a break above a major bearish trendline with resistance near $0.4840 on the 4-hour chart of the XRP/USD pair (Kraken data source).
- The pair could gain bullish momentum if there is a close above $0.515.
Ripple’s Token Price Looks Bullish Break
After another decline, Ripple’s XRP found support near the $0.458 zone against the US dollar. The price traded as low as $0.4589 and recently started a new increase, just like Bitcoin and Ethereum.
There was a move above the resistance at $0.480. XRP climbed above the 23.6% Fib retracement level of the downward move from the $0.5490 swing high to the $0.4589 low. Additionally, there was a break above a major bearish trendline with resistance around $0.4840 on the 4-hour chart of the XRP/USD pair.
The price is now trading below $0.505 and the 100 simple moving average (4 hours). It seems to be encountering resistance near the $0.505 zone.

Source: XRPUSD on TradingView.com
The next major resistance is near the $0.5145 level or the 61.8% Fib retracement level of the downward move from the $0.5490 swing high to the $0.4589 low. The main resistance is forming around $0.525. A successful break above the $0.525 resistance level could mark the start of a strong rally towards the $0.570 resistance. Further gains could require a test of the USD 0.600 resistance.
Another rejection in XRP?
If Ripple fails to break the USD 0.5145 resistance zone, it could trigger another decline. The initial downside support is near the $0.484 zone.
The next major support is at USD 0.458. If there is a downside break and a close below the USD 0.458 level, the price of XRP could extend losses. In the said case, the price could retest the USD 0.432 support zone.
Technical indicators
4-hour MACD – The MACD for XRP/USD is now gaining speed in the bullish zone.
4-hour RSI (Relative Strength Index) – The RSI for XRP/USD is now above the 50 level.
Major support levels – $0.484, $0.458 and $0.432.
Major resistance levels – $0.505, $0.515 and $0.525.

