
This article is available in Spanish.
In a new technical analysis of the XRP price in the weekly chart (XRP/USD), crypto analyst Dark Defender warns of a possible last big crash. The analysis uses Elliott Wave theory and delves into the historical and expected paths for XRP, highlighted by critical price levels and wave patterns.
Final Crash Coming for XRP Price?
According to Dark Defender, XRP closed its Wave 1 in mid-July last year at a high of $0.9327, significantly surpassing the initial targets set when the price was just $0.28. “Those know that we targeted $0.89 and above when XRP was at $0.28. However, XRP closed Wave 1 at $0.9327. So we haven’t decided on that yet, right? We set the boundaries and goals and then see. So right after the initial target, XRP started to consolidate,” said Dark Defender.
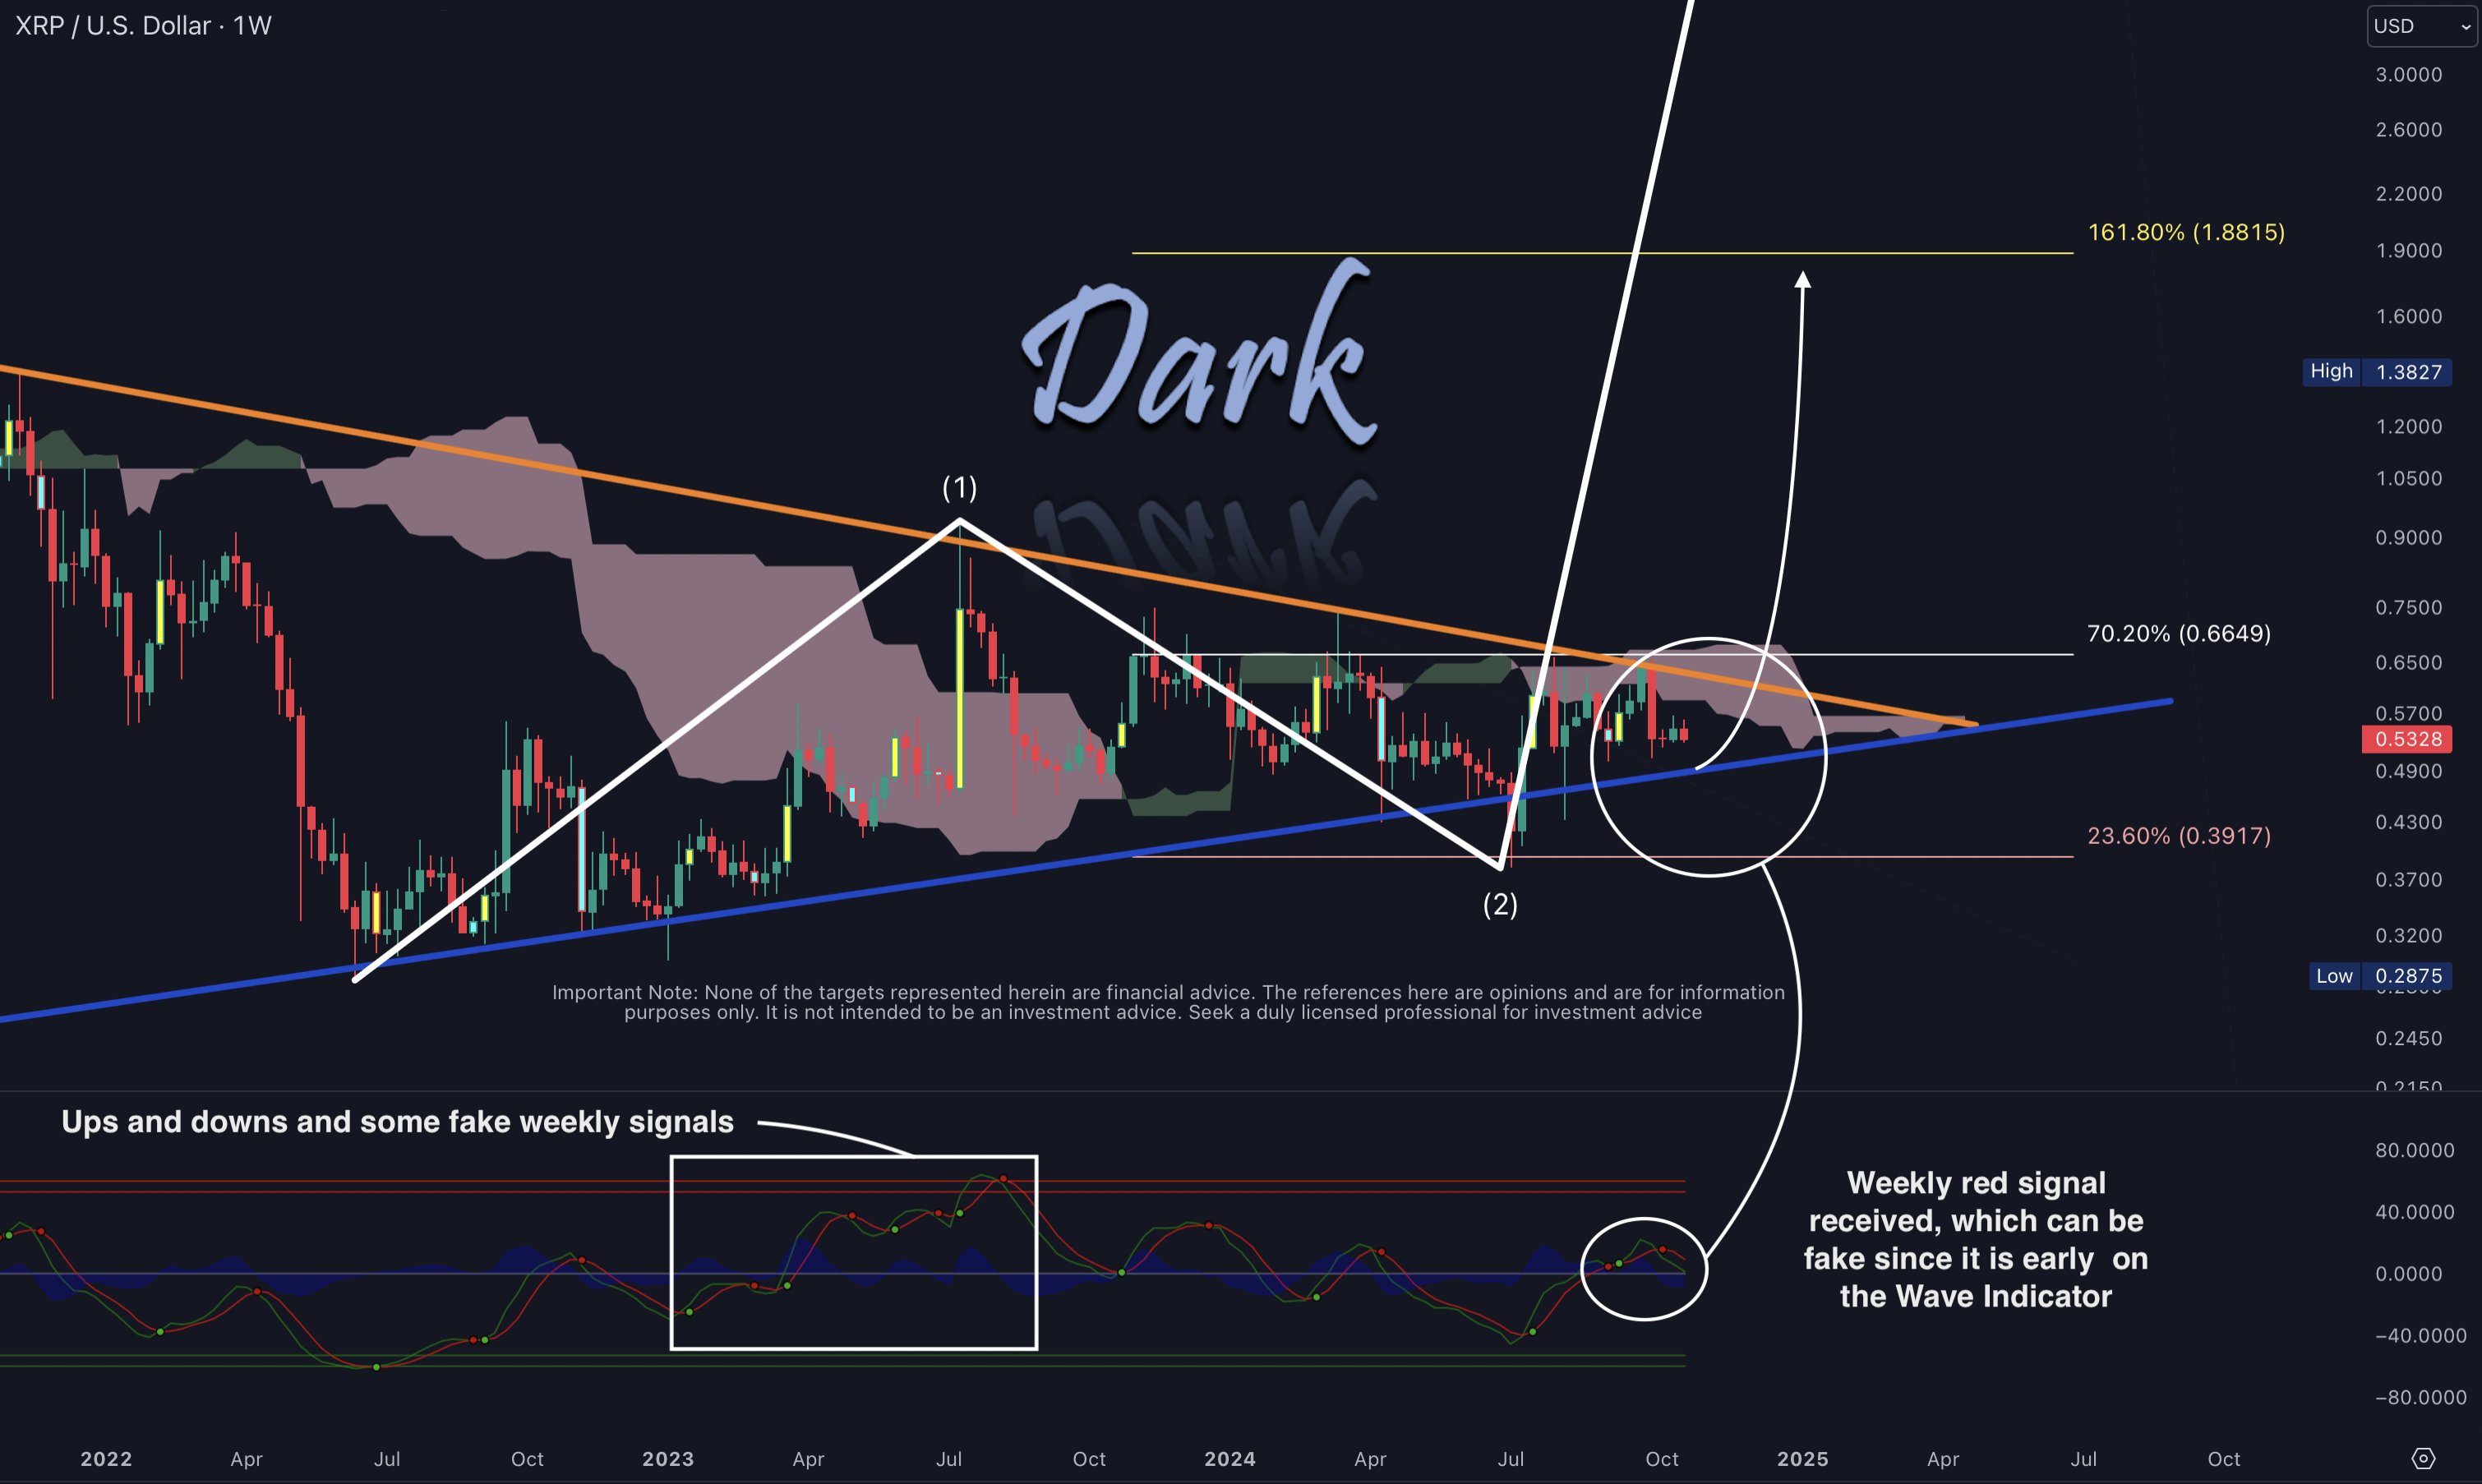
The chart analysis shows that the post-peak price action found a firm base at $0.3917, a level close to $0.3814, underscoring the accuracy of the predicted support levels based on Elliott Wave theory. “We all knew that our low was $0.3917, which we had set. Later, XRP touched almost exactly $0.3814. We then underlined several times that this area was the lowest Fibonacci zone,” the analyst stated.
Related reading
Heading into more recent activity, Dark Defender has put significant emphasis on the $0.6649 level, describing it as an “extraordinary level” and “the strongest of all.” The analyst notes: “And once we see XRP above $0.66, one day, one week, one month, we will see huge moves.”
However, the latest weekly Wave indicator is showing a red signal, indicating possible downward pressure. Dark Defender warns investors: “Right now the weekly indicator is giving us a red signal, which could be false, but tells us that, guys, the support levels of $0.5286, $0.4850 and the lowest probability of $0.3917 as a double dip must be considered. .”
While there is potential for a decline, the likelihood remains low, according to Dark Defender. “Can touch XRP here again!!! Oh God, yes, but that’s less likely.” Despite the short-term bearish signal, the monthly wave trend remains green, typically surpassing the weekly indicators, suggesting that the red signal could be premature.
Related reading
“Although the weekly signals are now red, the monthly wave trend is green, which trumps the weekly. This made me think the weekly is a fake signal at this stage,” the analyst explains, reinforcing the potential for continued bullish momentum in the longer term.
Remarkably, the wave indicator also gave false signals on the weekly chart during the first wave, which underlines Dark Defender’s long-term theory. He still believes that XRP’s Wave 3 “possible targets are $0.88, $5.85 and $18.22 respectively.”
However, before the price can rise that high, there is one last major resistance. “As long as $0.48 and especially $0.3917 hold, the XRP targets are clear, especially after $0.6649. Please don’t underestimate it and think what the heck is $0.66? It’s the red thin line. We know and see what is happening in the background. We see fewer people staying on the ship. But I trust myself, Ripple and XRP. We have exciting times ahead of us,” he says.
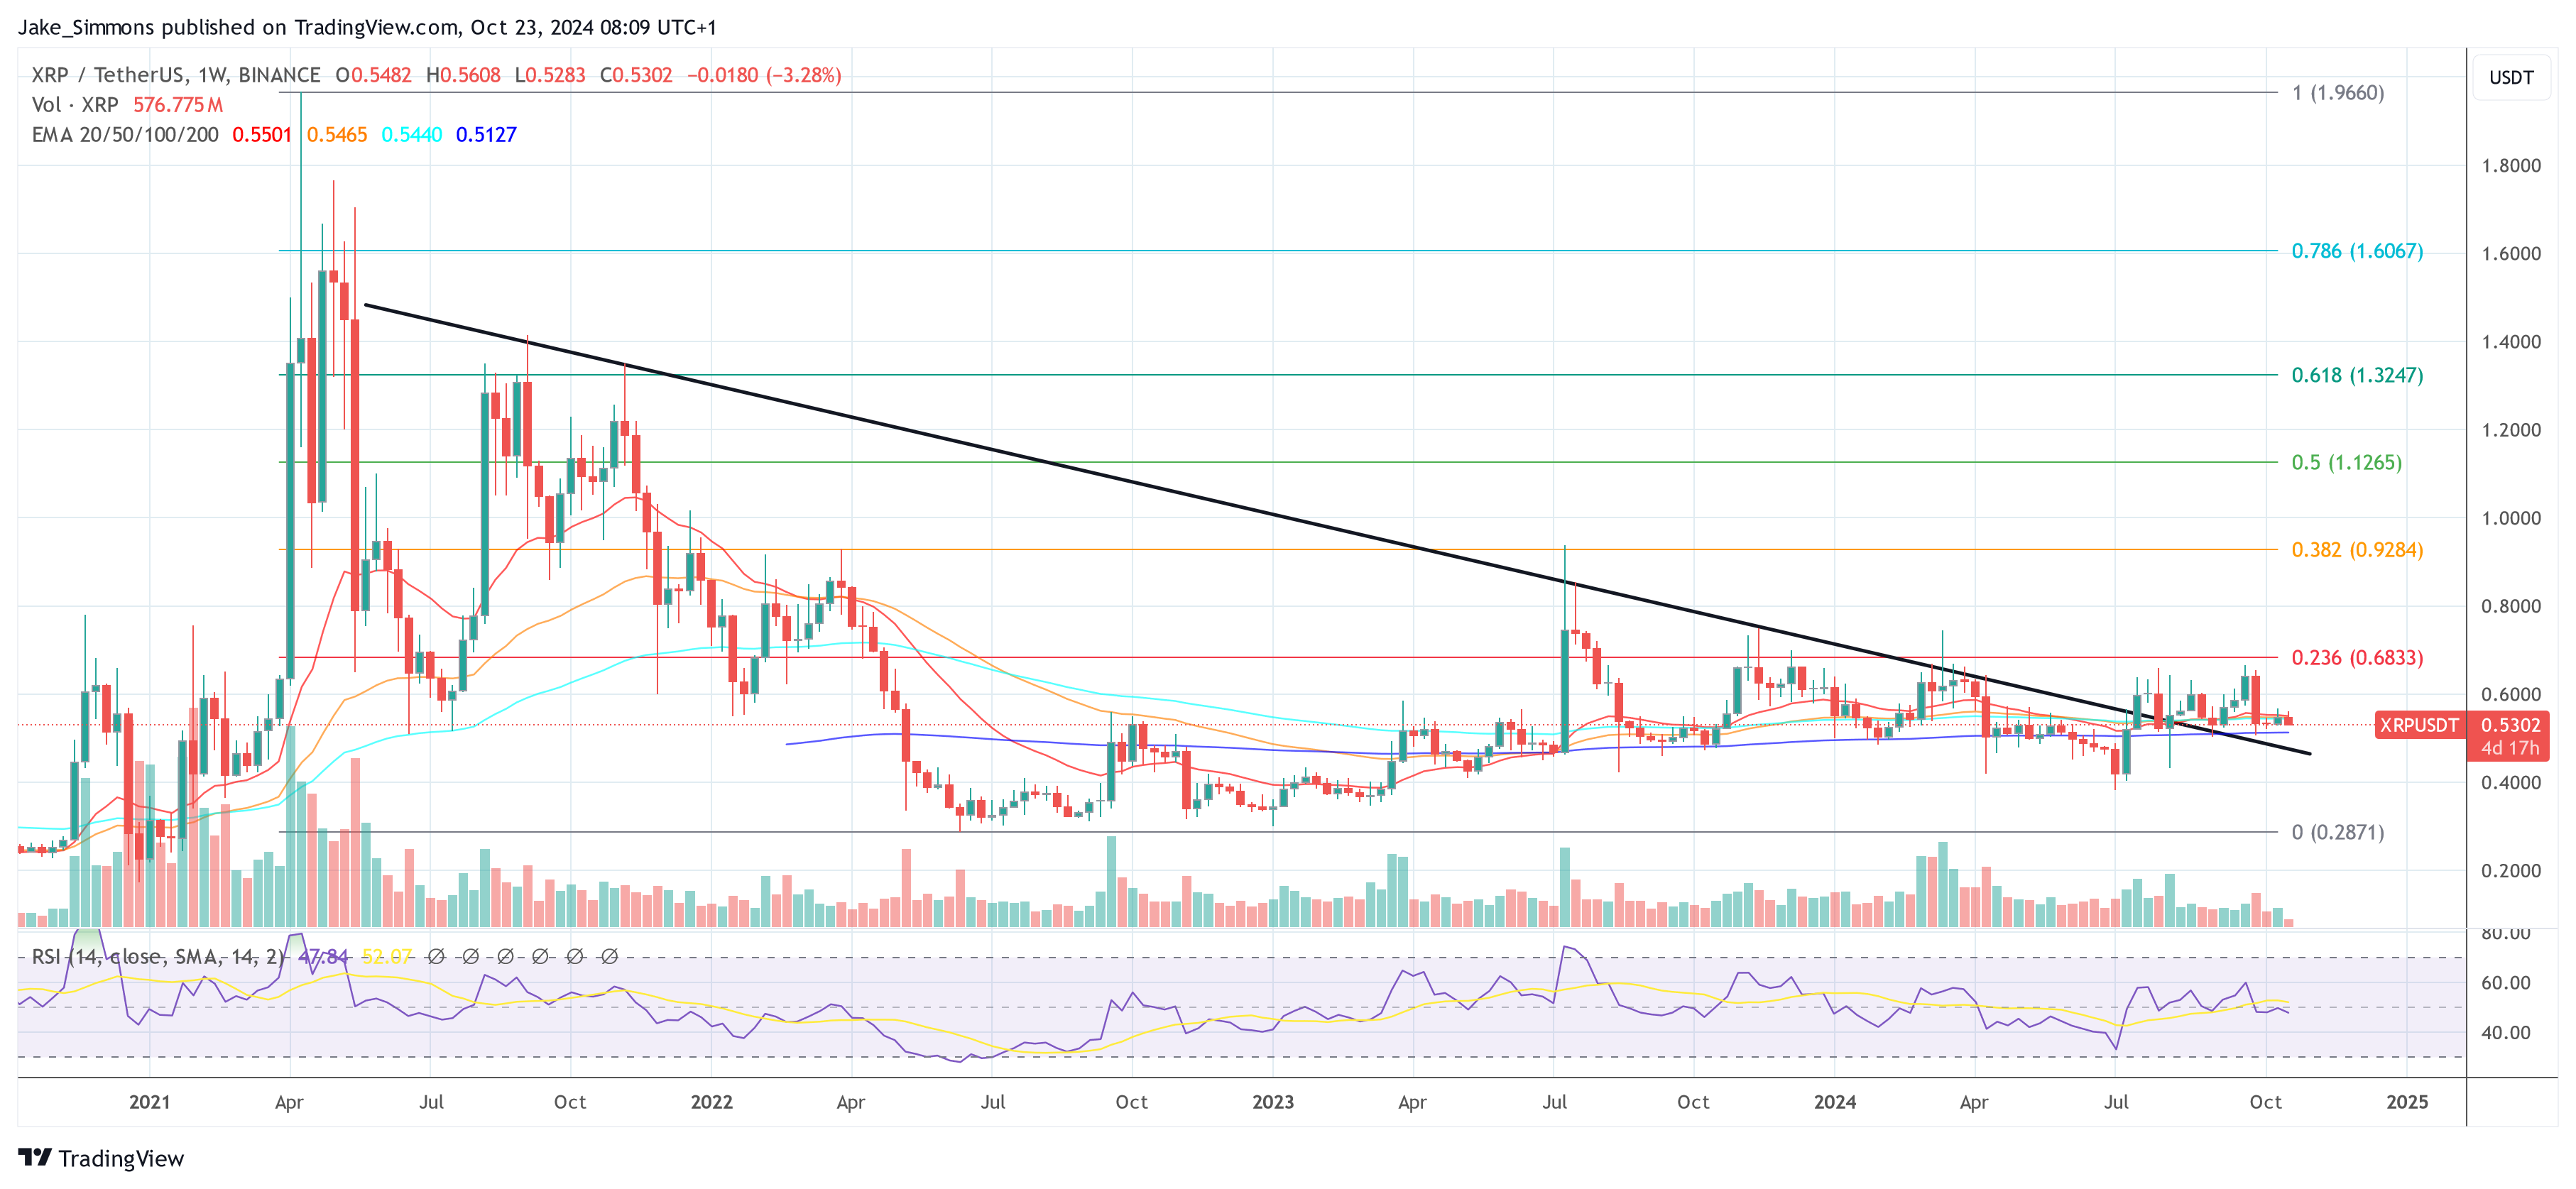
At the time of writing, XRP was trading at $0.5302.
Featured image created with DALL.E, chart from TradingView.com