

XRP price is consolidating above the USD 0.5920 level. The price could start a new increase if it crosses the USD 0.6050 resistance zone.
- The XRP price is eyeing a fresh increase from the $0.5920 level.
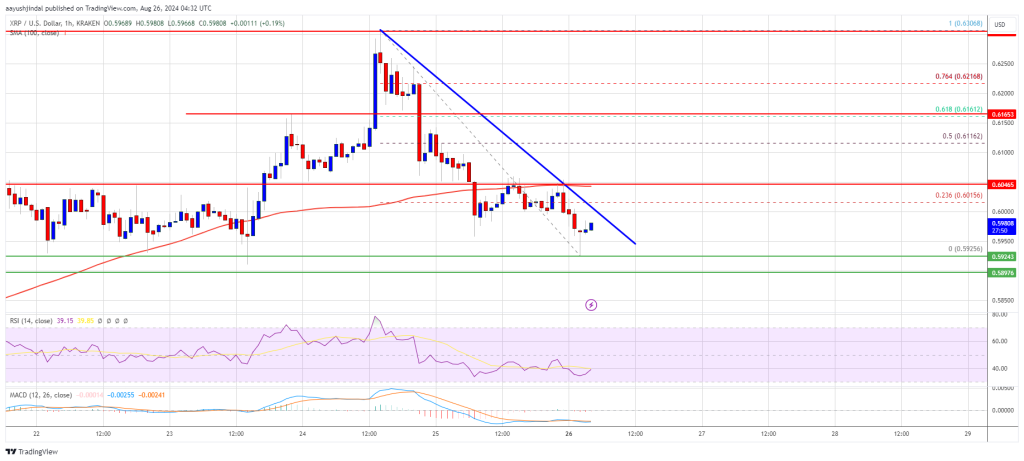
- The price is now trading below $0.600 and the 100-hourly Simple Moving Average.
- A connecting bearish trendline is forming with resistance at $0.6020 on the hourly chart of the XRP/USD pair (Kraken data source).
- The pair could start a new rise if it breaks the $0.6050 resistance zone.
XRP price aims higher
XRP price tried to rise again above the USD 0.6150 level. The price was able to break the USD 0.6180 and USD 0.6220 resistance levels. However, upside was limited above $0.630, unlike Bitcoin and Ethereum.
The price traded as high as $0.6306, paring most of the gains. It traded as low as $0.5925 and is currently consolidating losses. There was a small increase above the USD 0.5950 level. However, the price is now trading below $0.600 and the 100-hourly Simple Moving Average.
If there is a new increase, the price may encounter resistance near the USD 0.60 level. A connecting bearish trendline is also forming with resistance at $0.6020 on the hourly chart of the XRP/USD pair. It is close to the 23.6% Fib retracement level of the downward move from the $0.6306 swing high to the $0.5925 low.
The first major resistance is around the $0.6050 level. The next major resistance could be $0.6160, or the 61.8% Fib retracement level of the downward move from the $0.6306 swing high to the $0.5925 low.
A clear move above the USD 0.6160 resistance could send the price towards the USD 0.630 resistance. The next major resistance is near the $0.6350 level. Any further gains could send the price towards the near-term resistance at $0.6550 or even $0.6880.
More disadvantages?
If XRP fails to break the USD 0.6050 resistance zone, it could fall again. The initial downside support is near the $0.5920 level. The next major support is at USD 0.5880.
If there is a downside break and a close below the USD 0.5880 level, the price could continue falling towards USD 0.5650 in the near term. The next major support is at $0.5550.
Technical indicators
Hourly MACD – The MACD for XRP/USD is now losing pace in the bearish zone.
Hourly RSI (Relative Strength Index) – The RSI for XRP/USD is now below the 50 level.
Major support levels – $0.5920 and $0.5850.
Major resistance levels – $0.6050 and $0.6160.