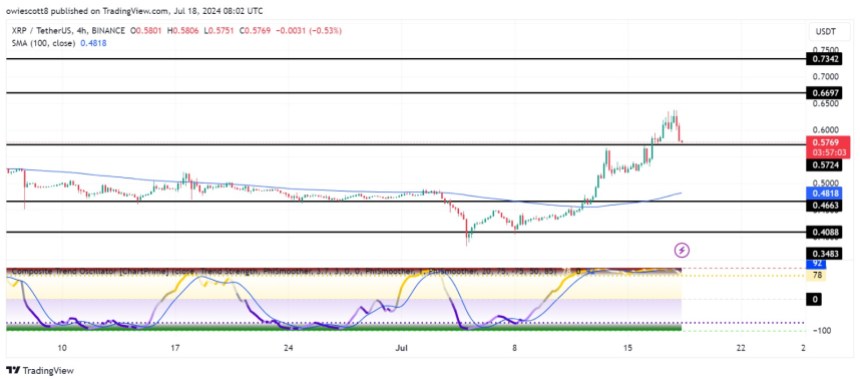
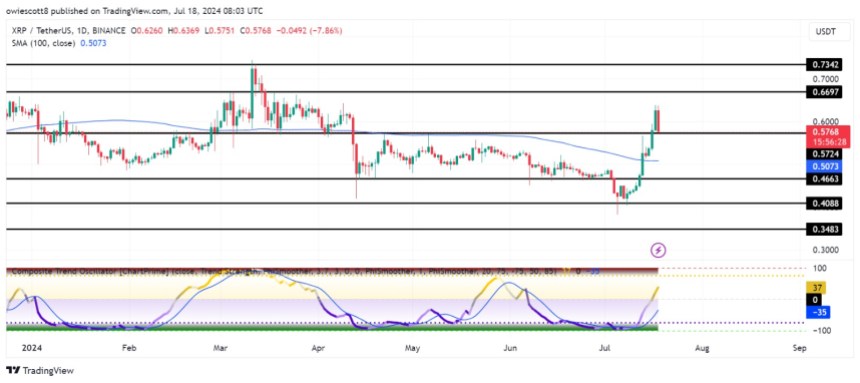
In recent trading, XRP has experienced a significant retracement, falling towards a critical support level at $0.5724. Seen as a corrective move to the crypto asset’s recent rally, this retracement has caught the attention of traders and investors alike, sparking speculation on whether the bulls can hold the $0.5724 support level .
This article provides an in-depth investigation into the meaning of the $0.5724 support level using technical indicators and the potential future scenarios that could unfold when the coin reaches the level.
The price of There has been a 3.70% drop in XRP market cap and a 17.22% increase in trading volume over the past 24 hours.
Market Overview: Understanding XRP’s recent price movement
On the 4-hour chart, XRP is still trading above the 100-day Simple Moving Average (SMA), but is currently on a bearish trajectory towards the $0.5724 support level. It is important to note that XRP had previously broken above $0.5724, which acted as a resistance level, and is now being retested for another test.

The 4-hour Composite Trend Oscillator confirms XRP’s recent price retracement as the signal line has crossed below the indicator’s SMA, with both indicators currently trying to break out of the overbought zone.
On the 1-day chart, XRP is making a bearish move towards the $0.5724 support level and the 100-day SMA. Despite this downward move, the broader trend remains bullish, suggesting this could be a short-term retracement.

Finally, it can be observed that the signal line has crossed above the SMA of the indicator and moved out of the overbought zone, with both lines trying to reach the zero line. This formation of the composite trend oscillator suggests that the long-term outlook remains bullish despite XRP’s current price decline.
The meaning of the $0.5724 support level
The support level at $0.5725 is very important for the future potential price movement of XRP. Therefore, should the price of A successful break above this target could serve as a catalyst and potentially trigger further upside to test the resistance at $0.7342 and beyond.
Nevertheless, if the price of A further break below the $0.4663 support level could lead to a price decline towards the $0.4088 support level and other lower levels.

