

Ripple token price is consolidating above $0.620 against the US dollar. XRP price could start a decent increase if there is a clear move above $0.650.
- Ripple token price is falling from the $0.6650 resistance against the US dollar.
- The price is now trading below $0.65 and the 100 simple moving average (4 hours).
- A major bearish trendline is forming with resistance near $0.628 on the 4-hour chart of the XRP/USD pair (data source from Kraken).
- The pair could continue to decline if there is no move above USD 0.63 and USD 0.65.
Ripple token price drops again
After a recovery wave, Ripple’s XRP struggled to overcome the $0.6650 resistance against the US dollar. A high was formed near $0.6654 before the price started another drop similar to Bitcoin and Ethereum.
There was a move below the $0.650 pivot level. The price fell below the 50% Fib retracement level of the upward move from the $0.5926 swing low to the $0.6654 high. The price even dropped below the $0.635 support zone.
XRP is now trading below $0.65 and the 100 simple moving average (4 hours). A major bearish trendline is also forming with resistance close to $0.628 on the 4-hour chart of the XRP/USD pair.
Initial resistance on the upside is near the $0.628 zone and the trendline. The next major resistance is near the $0.650 level and the 100 simple moving average (4 hours). The main resistance is now forming near the $0.6650 zone.
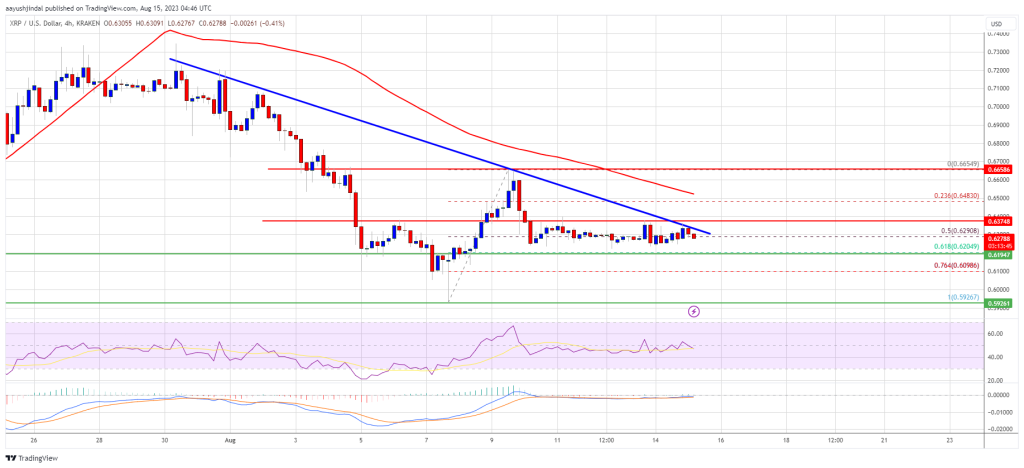
Source: XRPUSD at TradingView.com
A successful break above the $0.6650 resistance level could send the price towards the $0.70 resistance. Any further gains may require a test of the $0.720 resistance.
Lose more in XRP?
If Ripple fails to clear the $0.650 resistance zone, it could trigger another drop. Initial support on the downside is near the $0.620 zone and the 61.8% Fib retracement level of the upward move from the $0.5926 swing low to the $0.6654 high.
The next major support is near $0.60. If there is a downside break and a close below the $0.60 level, the price of XRP could add to losses. In the said case, the price might retest the $0.585 support zone.
Technical indicators
4am MACD – The MACD for XRP/USD is now losing pace in the bearish zone.
4 hours RSI (Relative Strength Index) – The RSI for XRP/USD is now below the 50 level.
Main Support Levels – $0.62, $0.60 and $0.585.
Key resistance levels – $0.628, $0.650 and $0.665.