

A prominent XRP holder is calling what he says a deliberate and recurring scheme to push the tokens price rising before US markets open – then drifting back down once trading begins.
Related reading
This claim has divided the XRP community between those who see a coordinated attack and those who say the data points to something much more routine.
A diagram, a pattern and a name for it
The community figure at the center of the debate is Arthur online. He posted a historical price chart showing XRP rising towards key resistance levels in the hours before US markets open, then quickly reversing after trading begins.
He counted nine separate cases of this series that has been going on since February, and says the same pattern has continued into March.
Arthur didn’t stop at simply marking the moves. He added a name to what he believes is behind it – calling it a possible “new Jane Street playbook,” a reference to the well-known quantitative trading firm.
🚨XRP IS NOW SYSTEMATICALLY MANIPULATED
Pumps straight to key resistance → US market opens → dumps 📉
Happens again and again.Is this the “NEW Jane Street playbook”?
XRP fell 44% from highs despite MASSIVE @Ripple news, ETF exposure, acquisitions, licenses…… pic.twitter.com/z6gqJwh6Eq
— Arthur (@XrpArthur) March 13, 2026
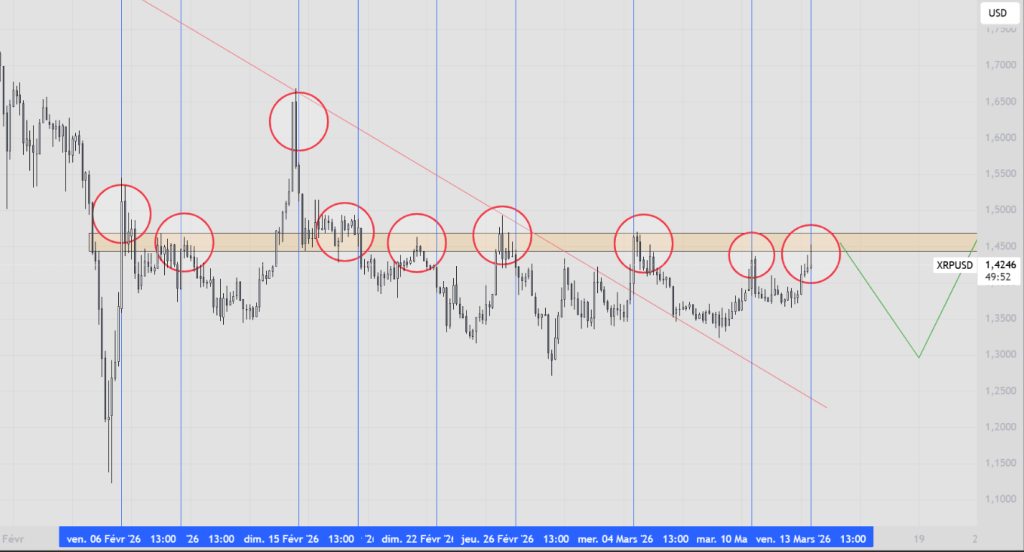
He argued that the sheer number of events, combined with the large number of leveraged long positions open during each episode, makes coincidence an unlikely explanation.
What adds to his frustration, at least from his perspective, is the broader background. Ripple has recently made headlines with billion-dollar acquisitions and continued ETF inflows.
But despite that activity, XRP remains about 40% below its level recent highlights. Every time the price tries to break out, sellers appear and push the price back down. Arthur sees that as part of the same problem.
The community is pushing back against the manipulation theory
Not everyone in the XRP community believed the argument. A trader named Robert W came into the conversation and offered one read differently.
His position was that these types of price movements often repeat themselves across multiple assets when liquidity floods openly into the US market.
Come on Arthur. Not everything is manipulation.
The same pattern occurs across multiple assets when US liquidity enters the market.
It looks more like normal liquidity shifts and profit-taking than a secret “Jane Street playbook.”—Robert W. | XRP Facts & Figures (@RobertXRPFF) March 13, 2026
According to him, profit taking and liquidity shifts are the most natural explanation, and not a coordinated institutional strategy.
Arthur rejected that outright. He pointed out the precision of the pattern: nine events, each following a period of accumulation with a large build-up of long positions.
Related reading
Level of consistency
That level of consistency, he emphasized, does not happen by accident. He called on several well-known voices in the XRP space – including Vincent Van Code, Crypto Eri, BankXRP, Digital Perspectives and Chad Steingraber – to take a closer look at the chart itself.
The debate wasn’t limited to price action for long. Another participant expressed a broader criticism of the crypto market, arguing that it is largely based on speculation.
Featured image from ECS Paymentschart from TradingView