

- XRP showed signs of a bullish reversal, with a double bottom formation at $0.40.
- The Ultimate Oscillator and RSI suggested a balanced state without strong buying or selling pressure.
XRP has recently shown a modest bullish reversal, prompting speculation about a potential massive rally.
This upward momentum has raised questions about whether XRP can maintain this trend and ultimately drive a bigger market rally.
AMBCrypto examined the XRP/USDt chart and saw a double bottom formation around $0.40, meaning a bullish reversal took place there.
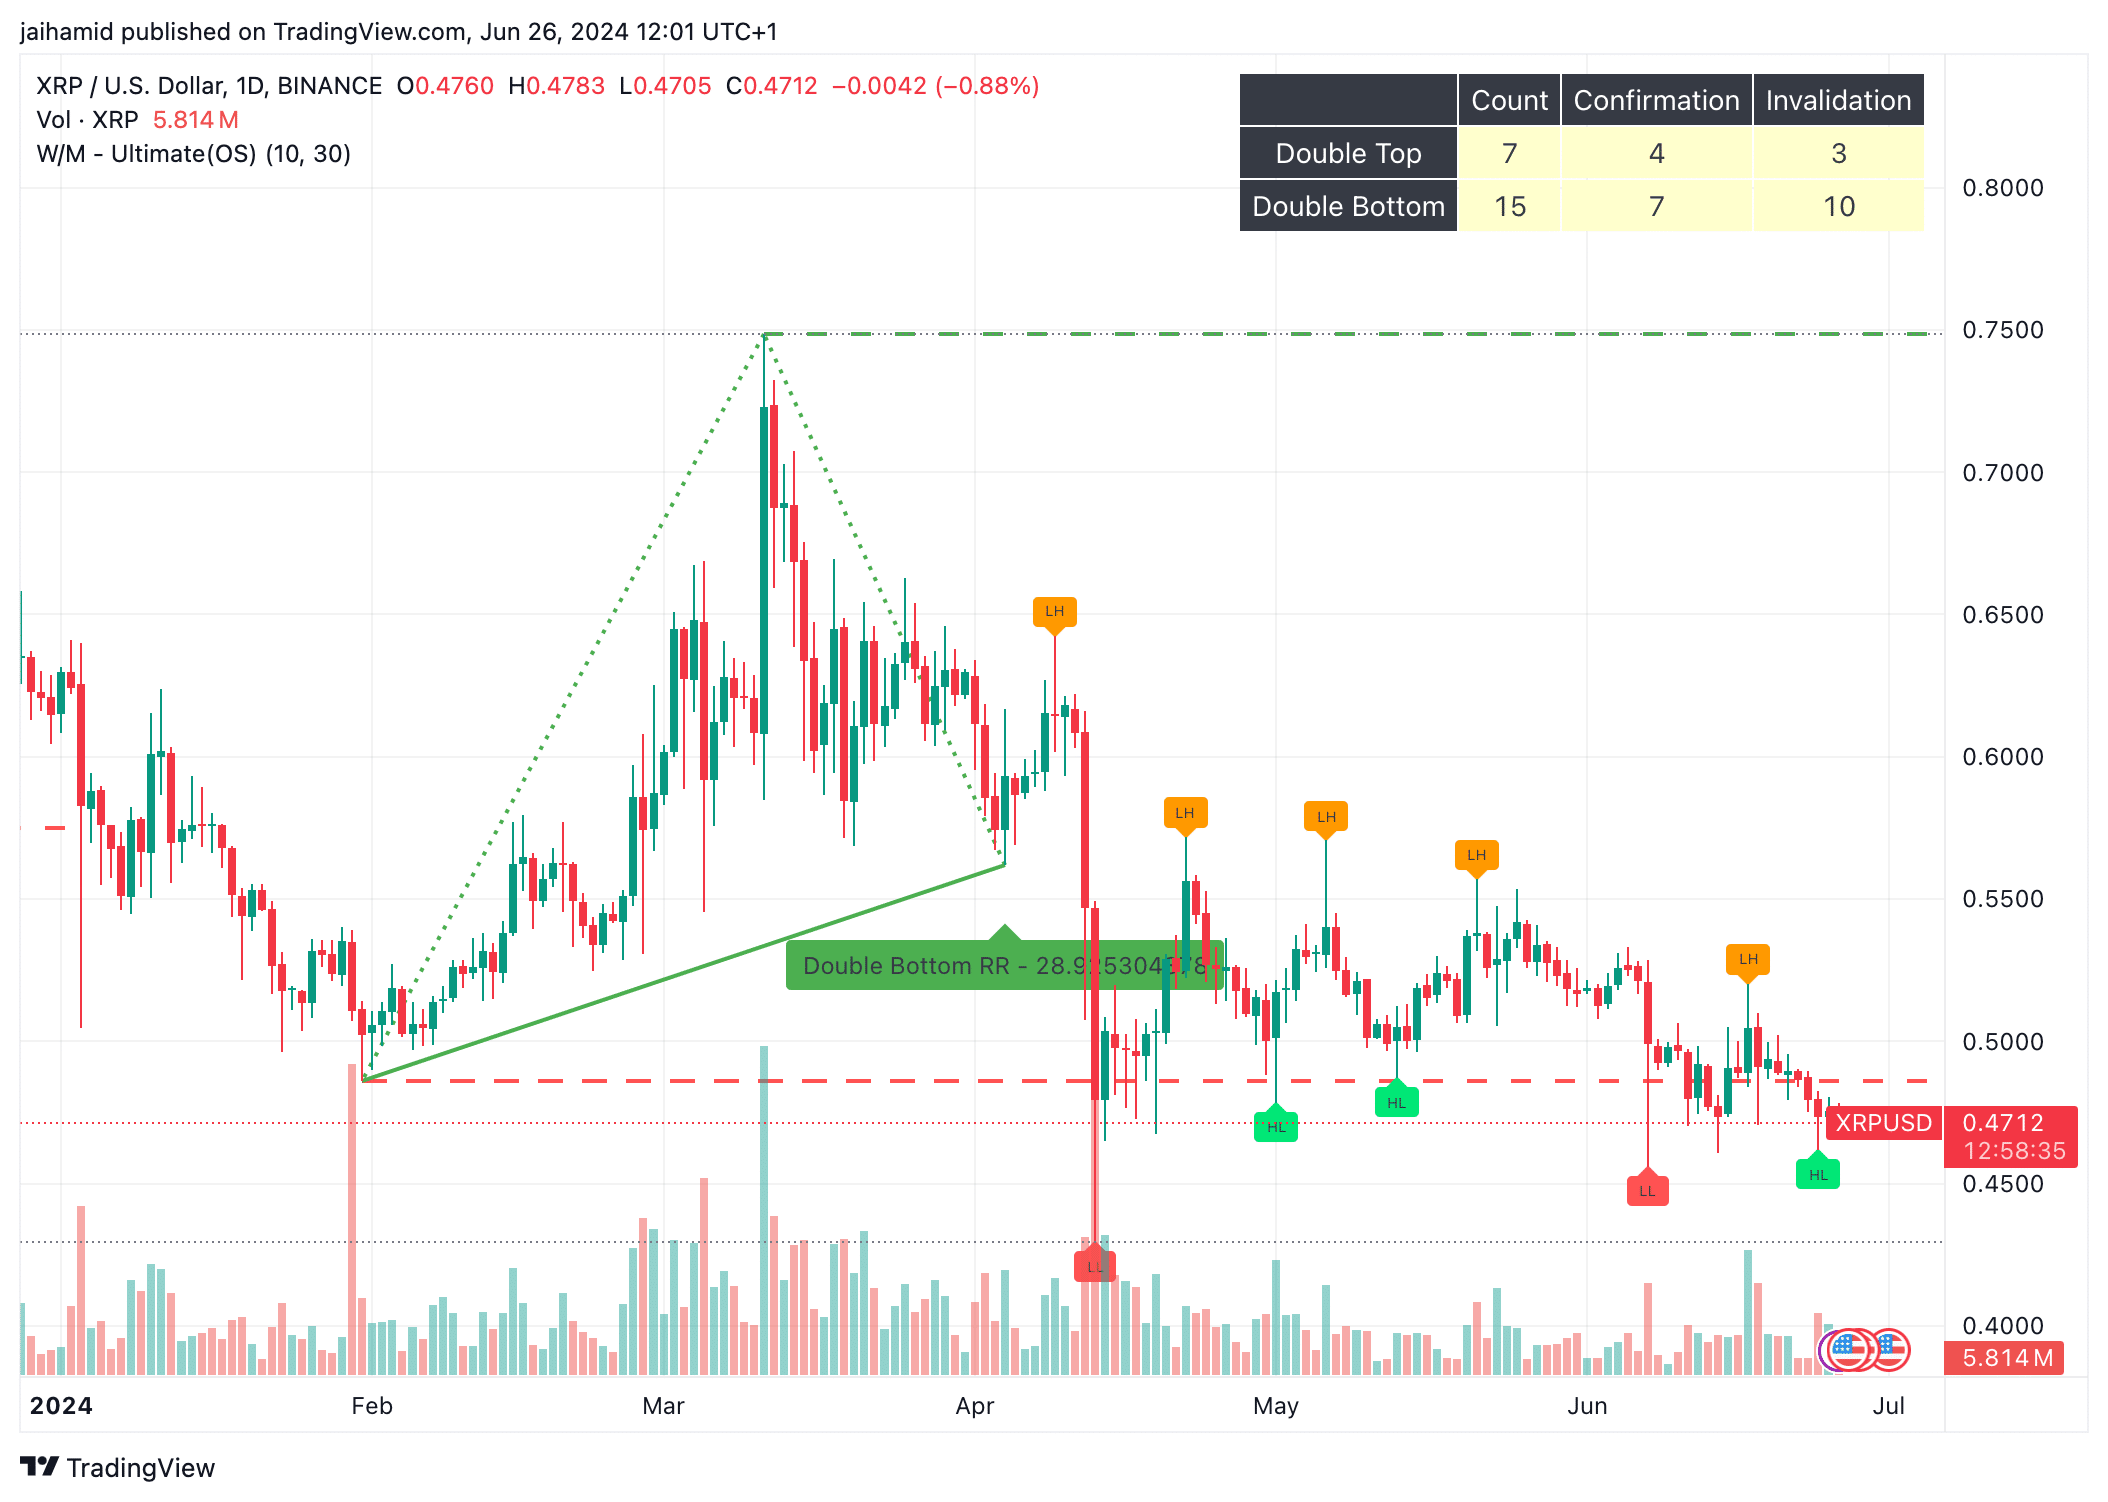
Source: TradingView
After the double bottom formation, the price staged a recovery but faced resistance around the $0.55 level as evidenced by the recent highs.
The repeated tests of this resistance without a break will either consolidate for another attempt higher or decline again as buyers lose momentum.
Current Ultimate Oscillator values around the mid-level indicate neither strong overbought nor oversold conditions, indicating a lack of decisive momentum in the market.
What Challenges XRP’s Bullish Outlook?
The main challenge for XRP is to break the USD 0.55 resistance and hold above USD 0.55. This could confirm a continued bullish reversal pattern and potentially lead to a test of higher resistance levels around $0.65.
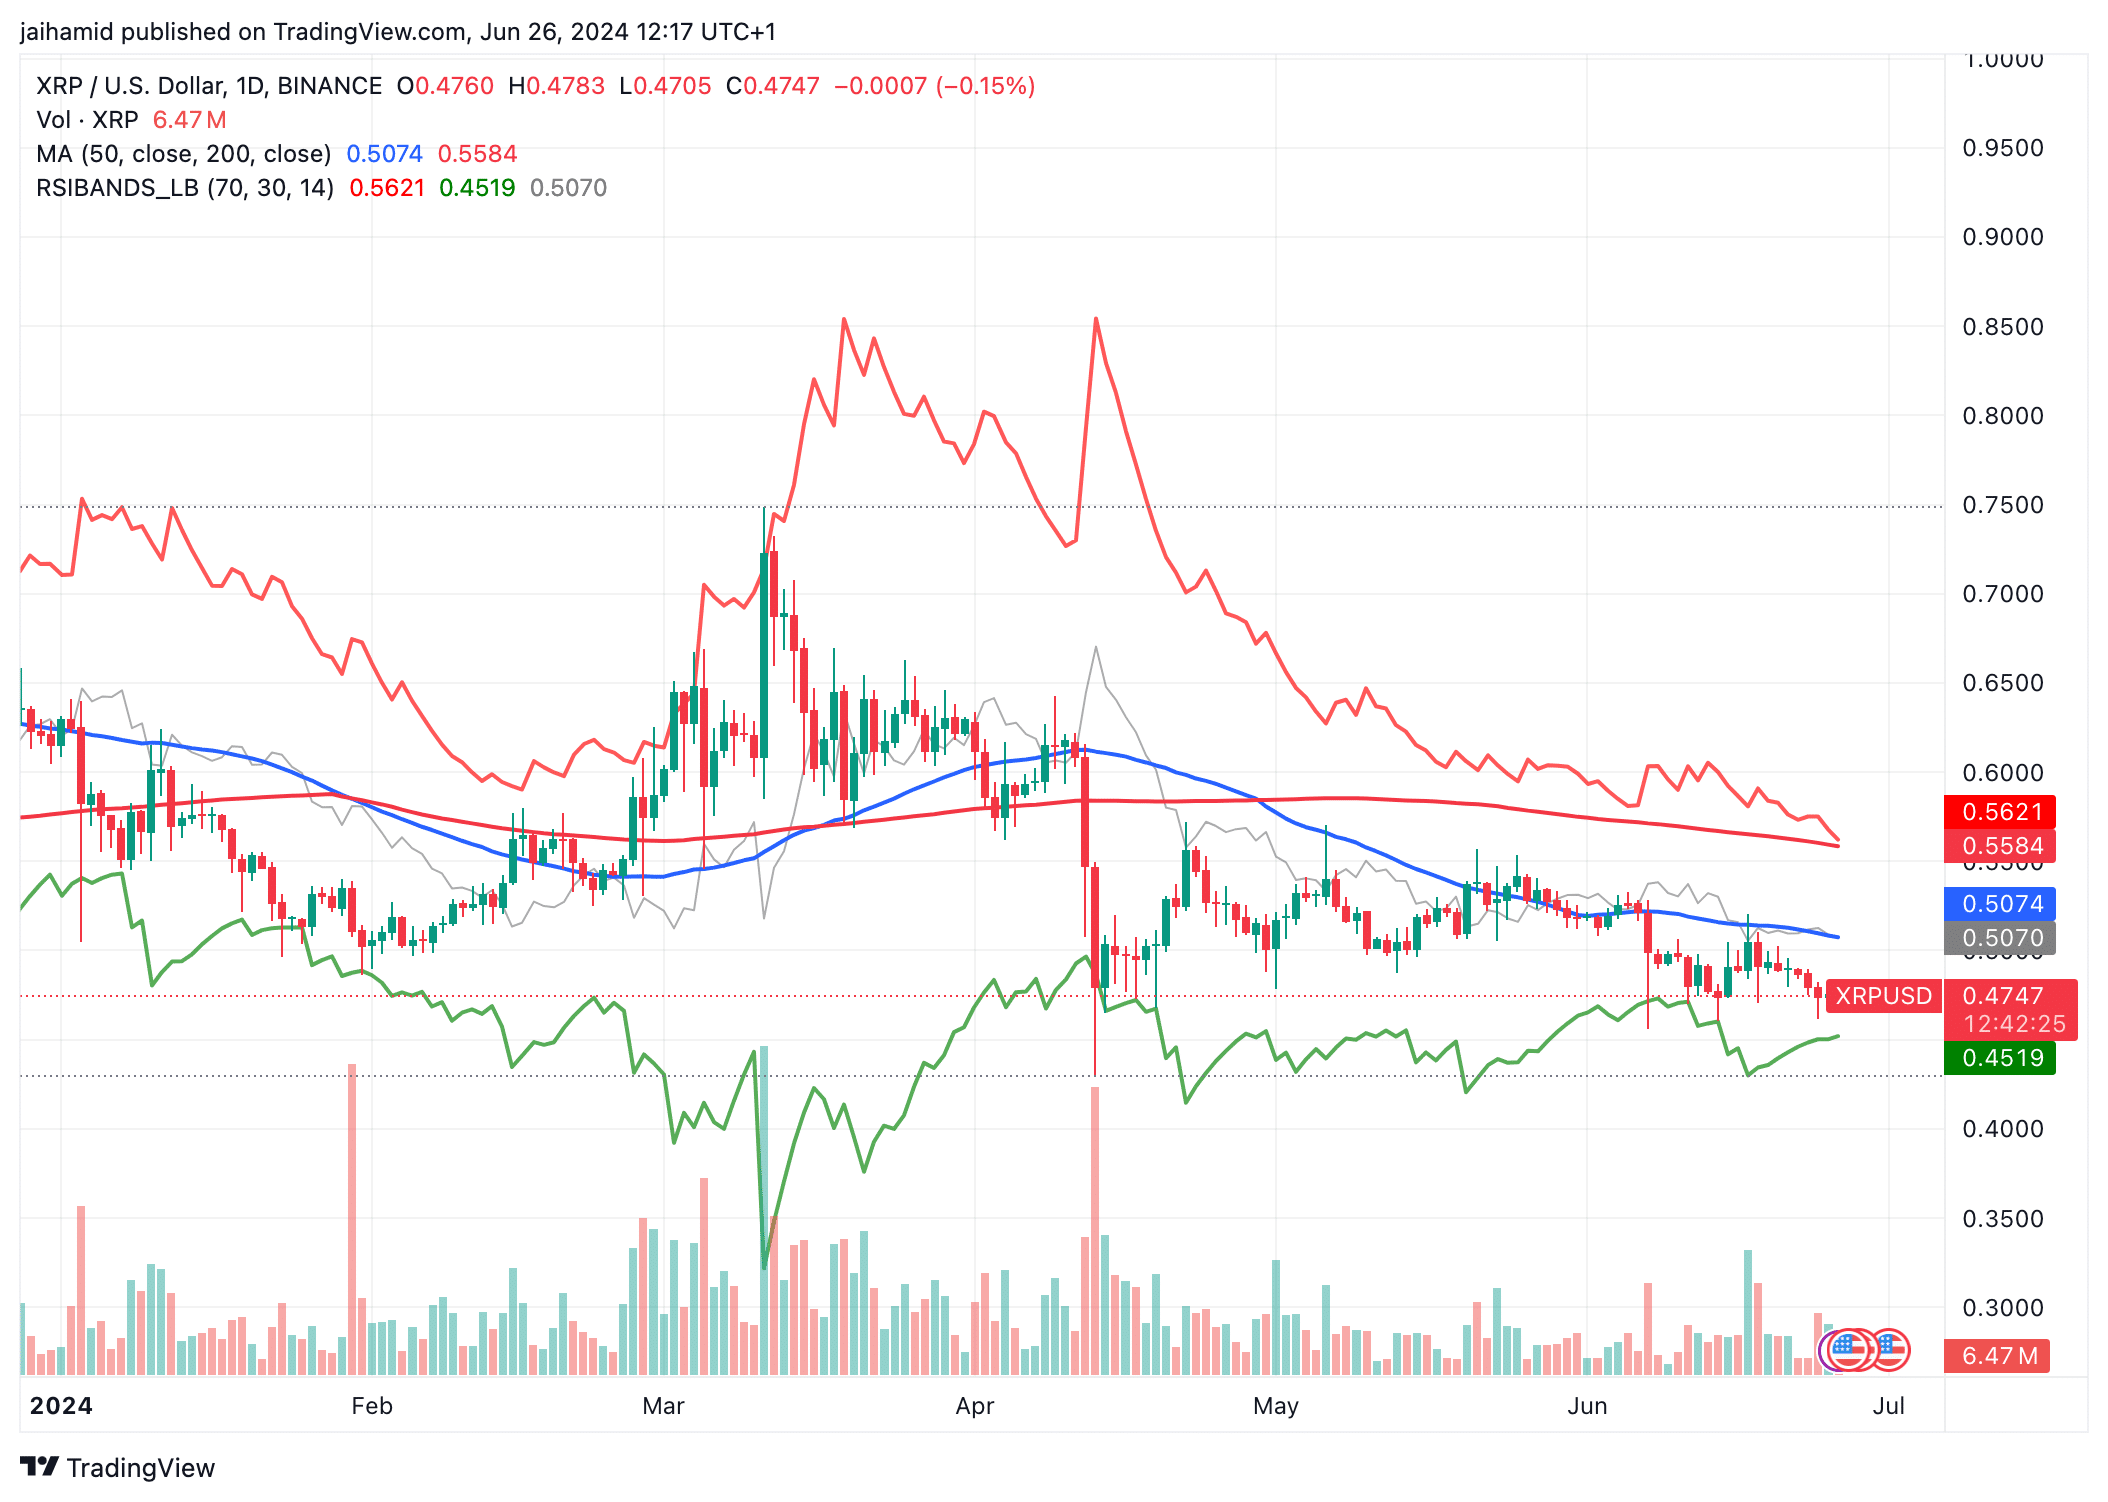
Source: TradingView
The range-adjusted Relative Strength Index (RSI) showed a reading just below the midpoint (50) at the time of writing, suggesting the price was neither in oversold nor overbought territory.
The price of XRP has fluctuated within a relatively narrow range between the MA50 and the support line at around $0.4519.
This could lead to consolidation, with traders potentially waiting for a clearer signal before making bigger moves.
The convergence of the moving averages means that there are bearish undertones due to the placement of the MA200. XRP’s social dominance and volume remained strong, correlating with large trading activity.
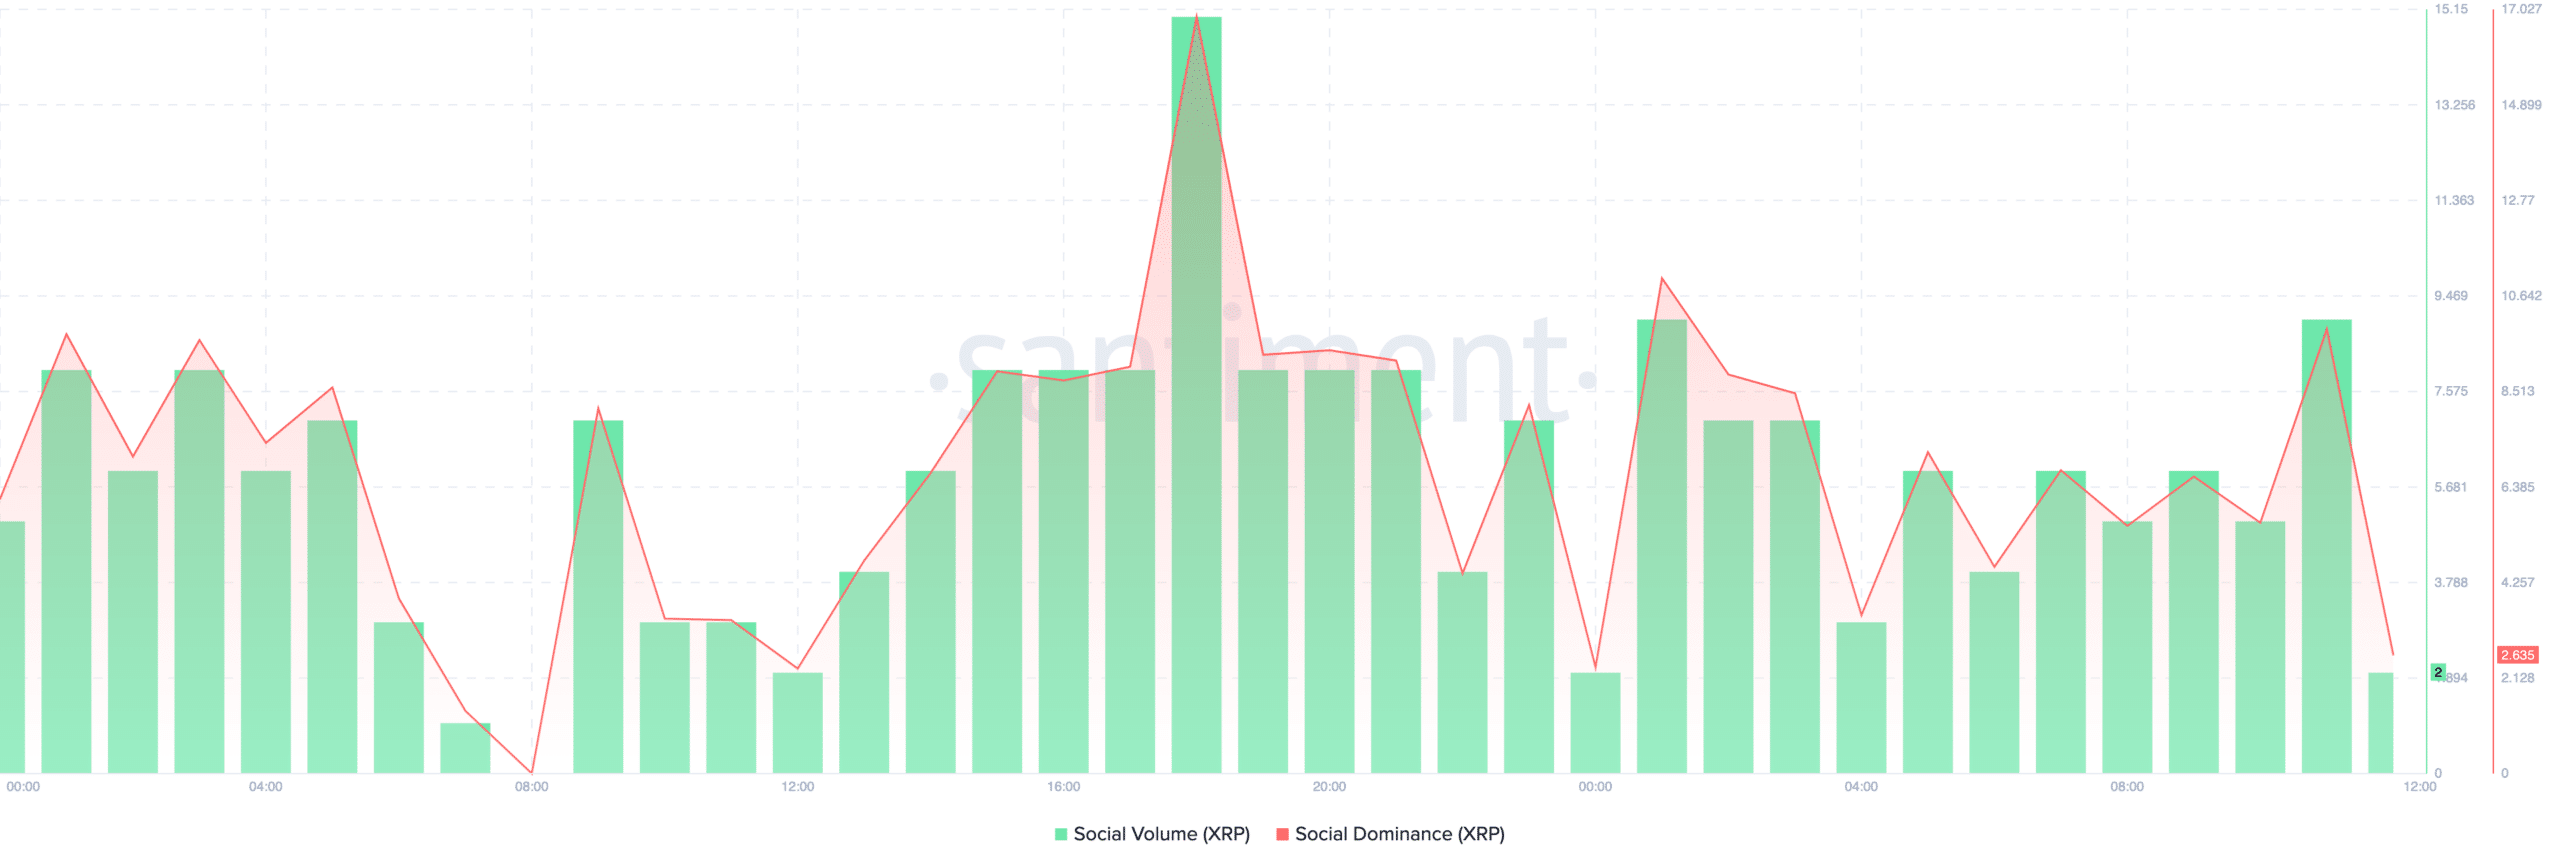
Source: Santiment
A certain degree of correlation is visible between foreign exchange inflows and price declines.
Is your portfolio green? Check out the XRP profit calculator
For example, peaks in inflows on June 19 and 22 corresponded with noticeable price declines, indicating selling pressure after the inflows.
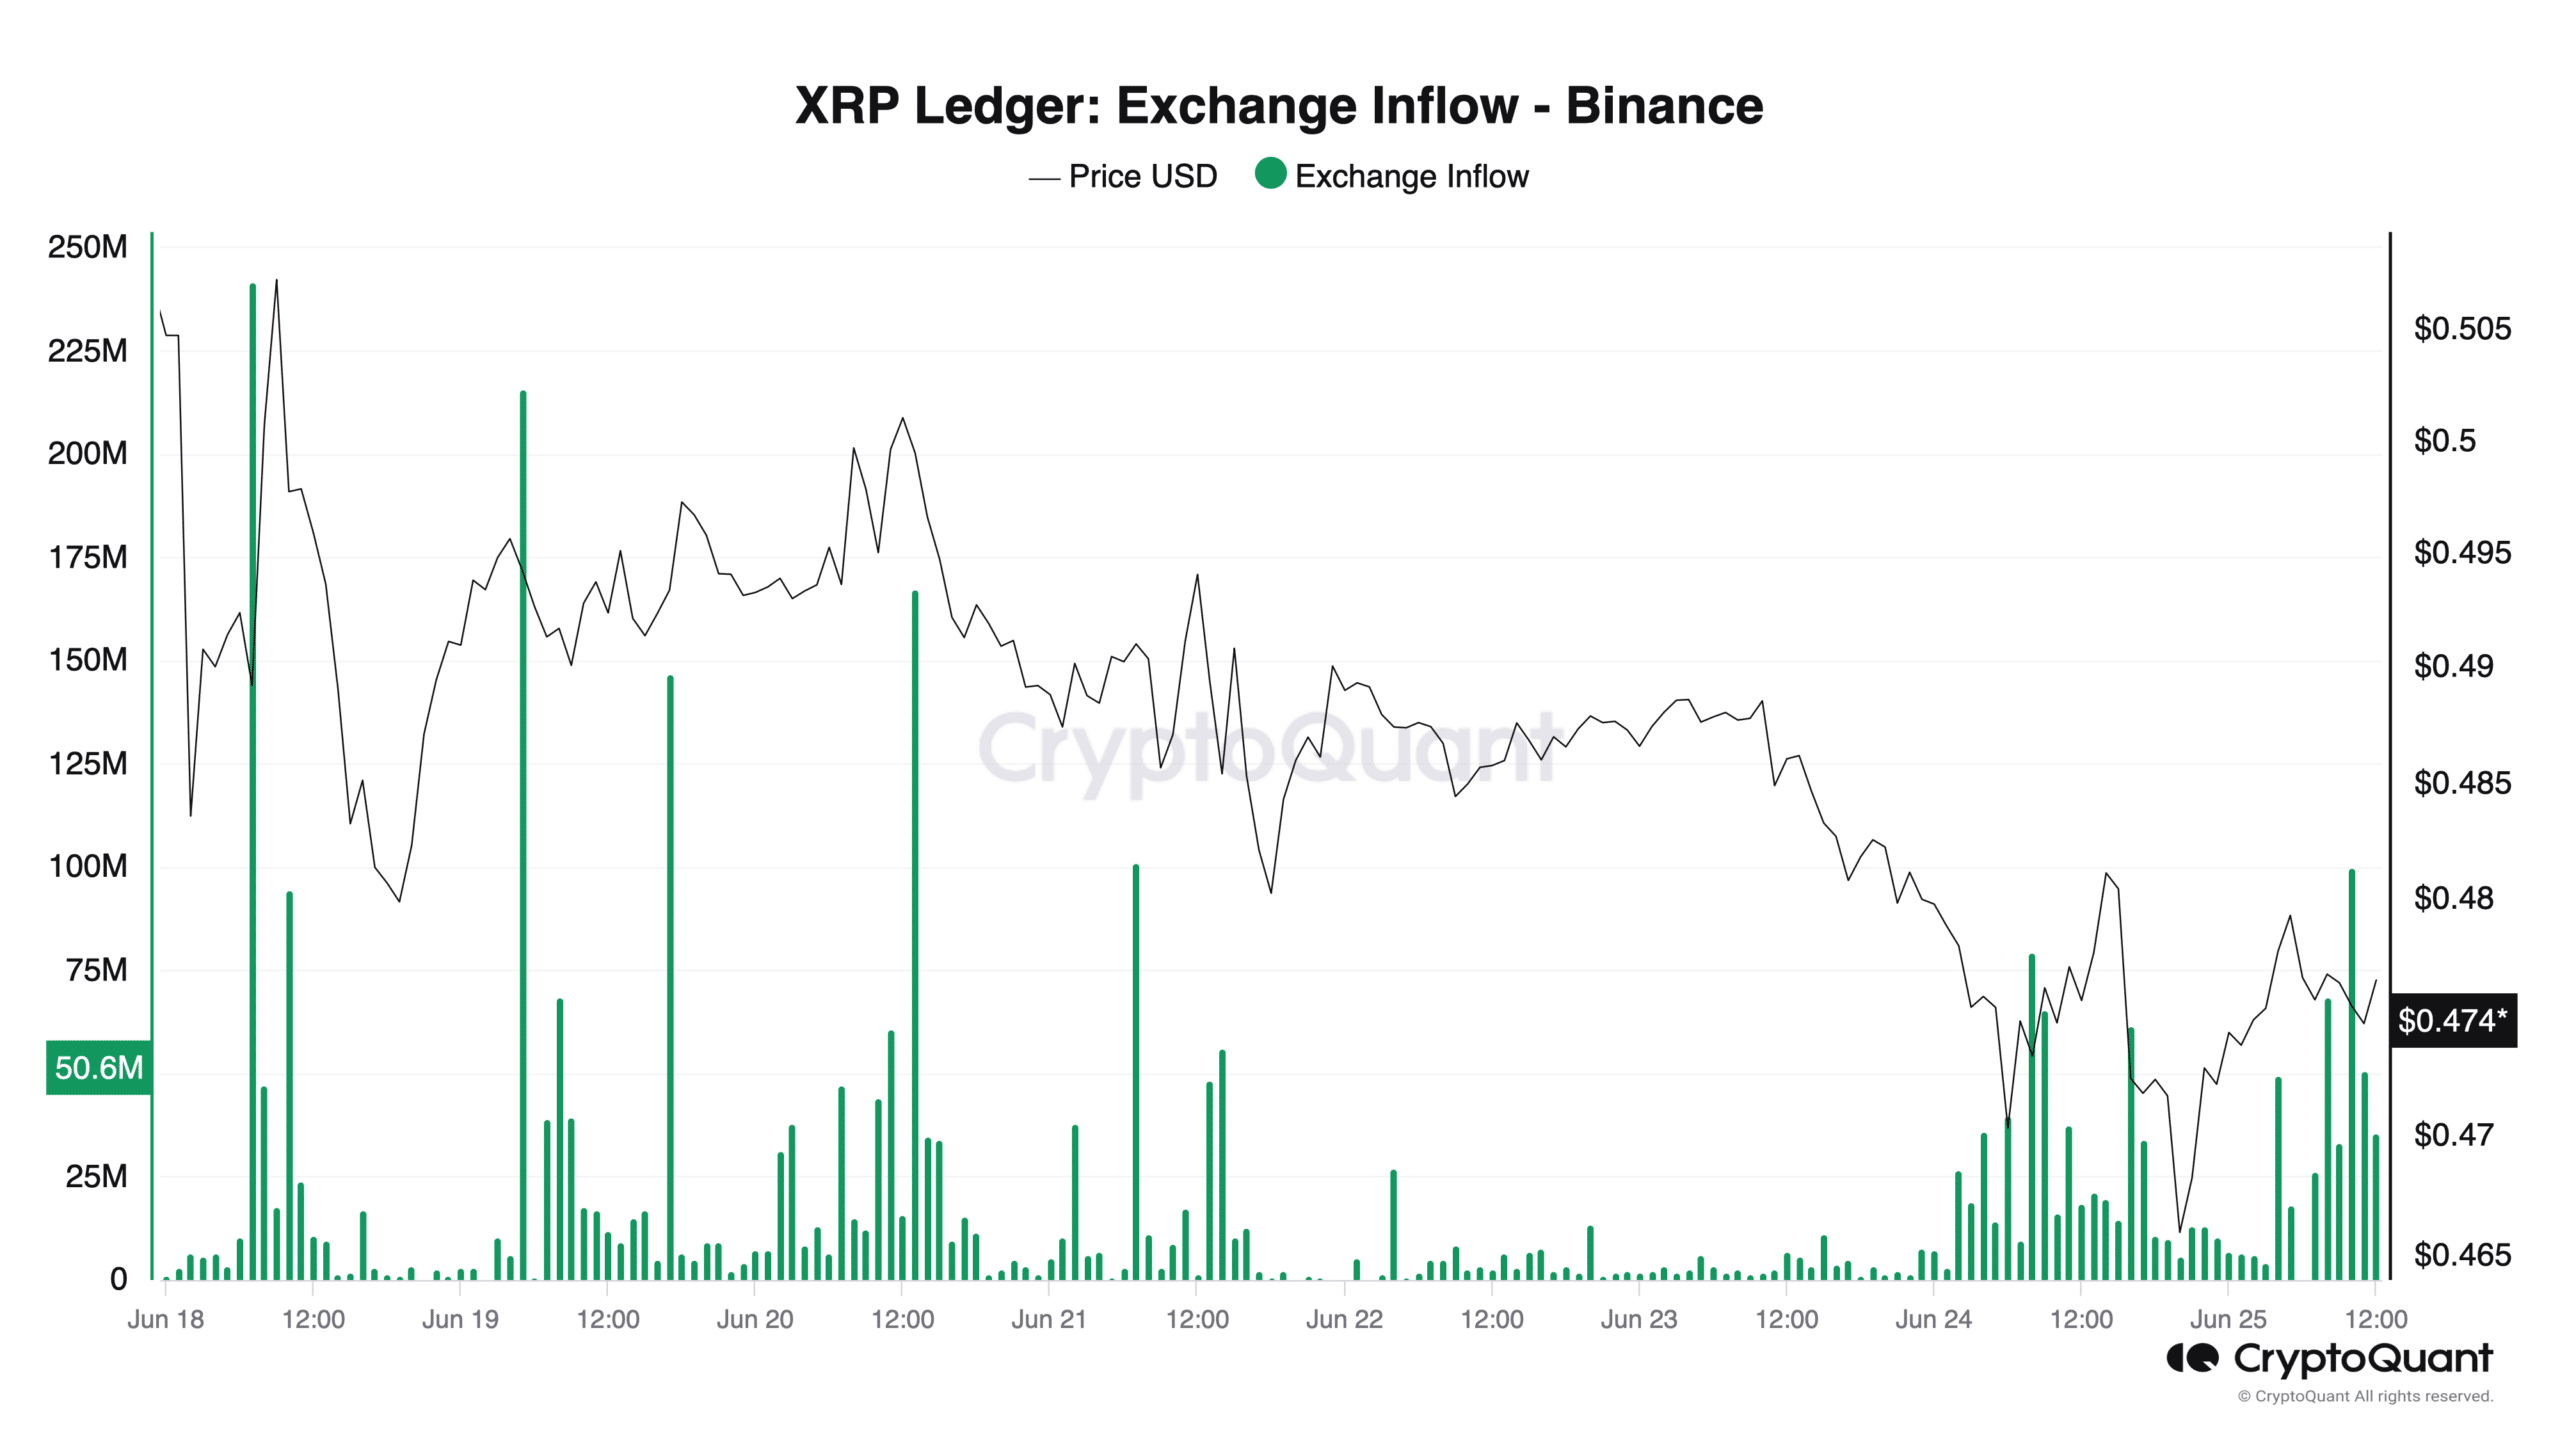
Source: CryptoQuant
The high inflows could also reflect bearish sentiment among investors, prompting them to sell their investments, possibly in response to market news or price expectations.