

- A trendline break positioned NEAR for a comeback from $20 all-time high.
- Rising volumes and fees strengthened NEAR’s momentum.
NEAR protocol [NEAR] is quickly emerging as a standout player in the blockchain ecosystem, leaving competitors like Solana behind in terms of technology and user adoption.
NEAR stands out with groundbreaking innovations such as sharding technology, making it one of the most scalable blockchains available.
With the full support of NVIDIA, the third largest company in the world, NEAR is positioning itself as a potential “right hand” of Ethereum. It bridges the gap between scalability, innovation and real-world application.
NEAR is currently trading at $6.69, up 3.11% in the last 24 hours, and has a 24-hour volume of $930.76 million.
While still 68.08% below the January 2022 all-time high of $20.42, the protocol’s progress and market traction indicate significant upside potential.
With its growing ecosystem and increasing relevance in AI-driven applications, analysts speculate that NEAR could achieve exponential growth, with returns of up to 15x as adoption accelerates.
Important support and resistance levels
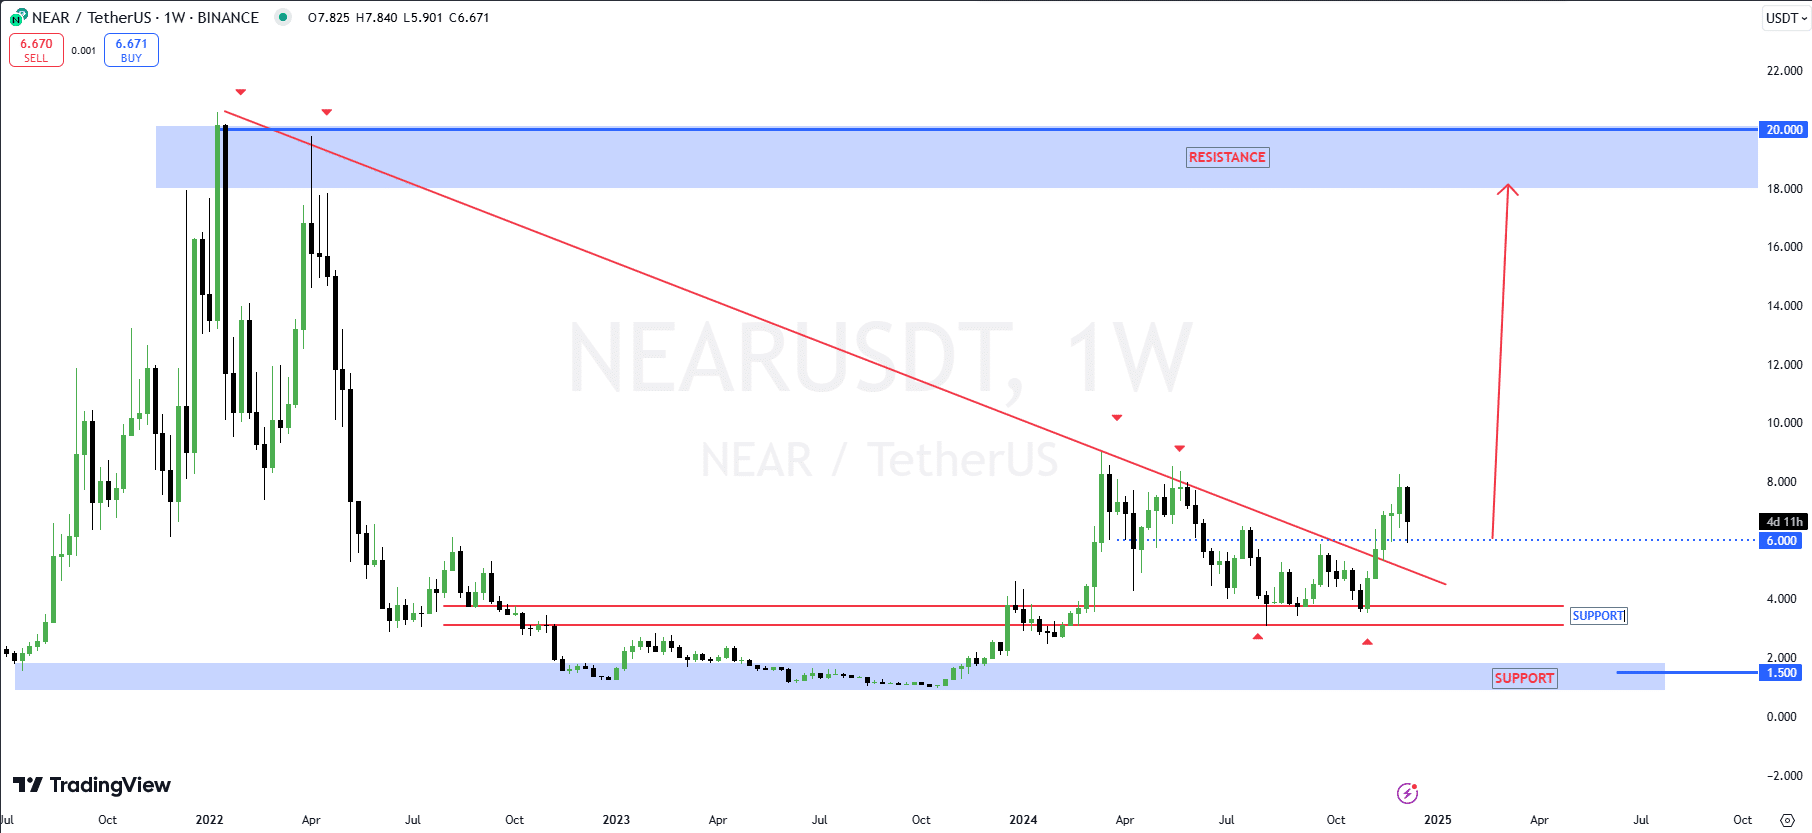
An AmbCrypto analysis of NEAR on the weekly time frame highlights key technical levels and trends. The primary resistance zone is $20.00, which matches the previous all-time high in early 2022.
The downtrend line indicates a long-term bearish trend that was recently broken by NEAR, indicating a shift to bullish momentum.
However, the current price of $6.69 is trading below the immediate resistance zone, near $8.00. This is consistent with recent price consolidation and selling pressure.
Source: TradingView
On the downside, strong support is visible around $6.00, just below the current price. This level coincides with previous resistance that turned into support, and provides an important basis for further bullish moves.
Below this, additional support exists around $4.00 and a critical long-term support zone around $1.50, which lines up with historic lows.
A successful break above $8.00 could pave the way for a retest of $20.00. Failure to hold $6.00 could lead to a deeper correction towards $4.00 or even $1.50.
Momentum indicators are signaling a reversal
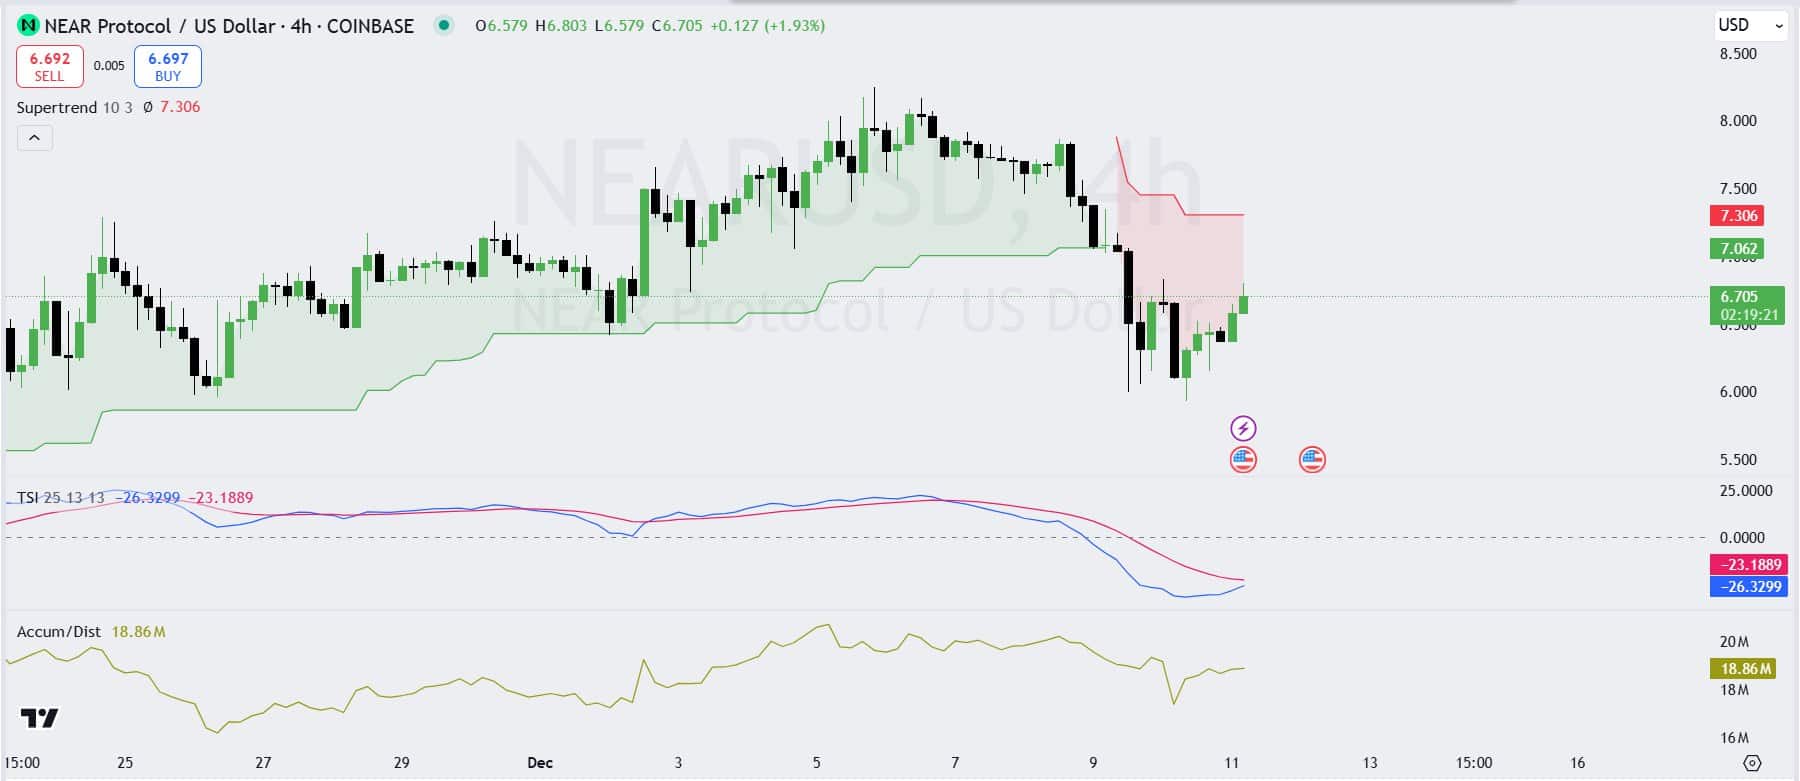
The Supertrend indicator shows a bearish bias, with resistance at $7,306. The price has recently bounced back from lower levels around $6.57 and is now testing the bottom of the bearish Supertrend zone, indicating potential resistance at this level.
A sustained break above $7,306 could signal a shift towards bullish momentum. For now, however, bearish pressure remains.
Source: TradingView
The True Strength Index remains in negative territory, with values at -23.18 (signal line) and -26.32 (momentum line). This indicates continued downward momentum, although the narrowing gap between the lines suggests that bearish momentum is weakening.
Furthermore, the accumulation/distribution line stands at 18.86 million, showing mild accumulation after recent declines. This points to modest buying interest, which could support a recovery if confirmed by other indicators.
Increase in the volume and costs of NEAR
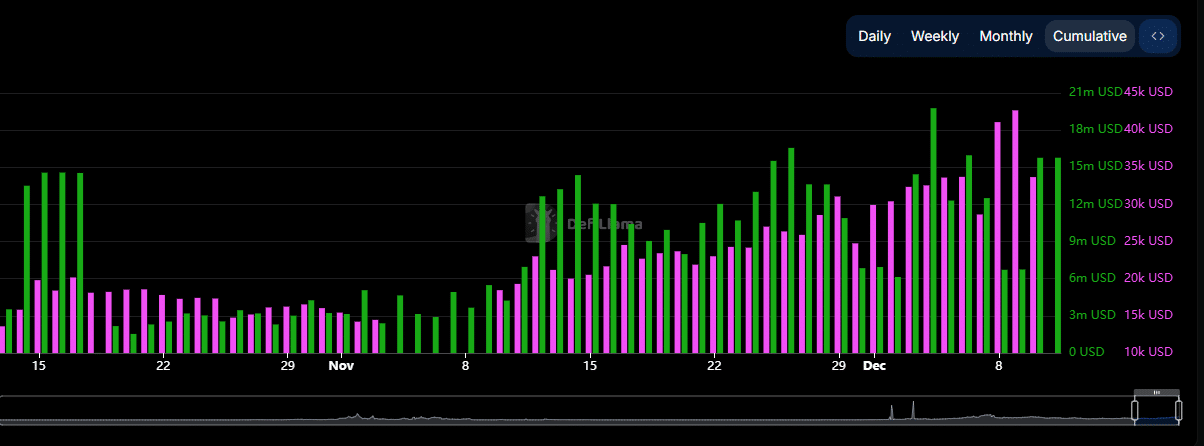
Volume (green) started with moderate activity in mid-November, but began to increase significantly towards the end of the month, peaking in early December.
This upward trend reflects growing networking activity, likely driven by increased interest in NEAR’s scalability and ecosystem developments.
Notably, daily volume reached peaks of over $18 million, demonstrating strong adoption and engagement on the platform.
Source: Defillama
Transaction fees (red) followed a similar trajectory, rising steadily along with volume. This indicates more interactions in the chain and an increase in user activity.
The alignment between volume and fees indicates healthy network usage, as fees are directly related to transactional demand.
Short and long liquidations are building up…
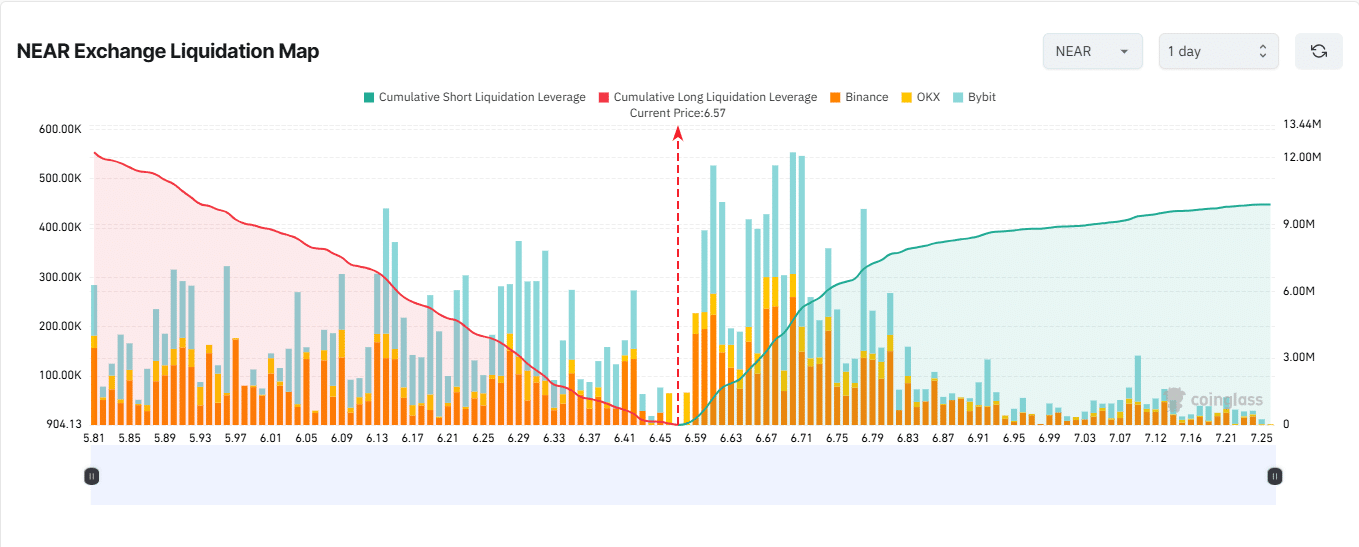
An analysis of the NEAR liquidation map reveals crucial insights into leveraged positions and potential market volatility. Significant levels of liquidation are concentrated around the current price, with long positions (green) showing increased vulnerability.
Cumulative long liquidations rose sharply from $6.45, peaking at almost $6.67, with more than $9 million in value at risk. This reflects a strong bullish bias, with traders taking long positions in anticipation of upward momentum.
Source: Coinglass
On the short side (red), liquidations fell steadily as prices rose above $6.45, dropping to $6.83. There is a lower concentration of bearish leveraged positions than long positions.
Read the NEAR protocol [NEAR] Price forecast 2024–2025
This dynamic highlights a precarious balance between bulls and bears, where a breakout in either direction could trigger a cascade of liquidations, leading to increased volatility in the short term.