

Polkadot (DOT), a prominent player in the blockchain ecosystem, is currently experiencing a dramatic decline, prompting a bearish alert. The cryptocurrency is in free fall and its price is dropping to new lows. A combination of market-wide volatility, negative investor sentiment and regulatory pressure is fueling this sharp downturn. As DOT’s value continues to erode, investors are advised to brace for further losses and reassess their strategies in light of these bearish signals.
In this analysis, we dive into Polkadot’s price outlook using some technical indicators focusing on the 1-hour and 4-hour time frames.
DOT price still actively bearish
The DOT price on the 4-hour chart made a retracement after a break from the previous one bearish triangle wedge and started to descend again. Although the price is currently trying to rise, the reality is that it will continue to fall afterwards.
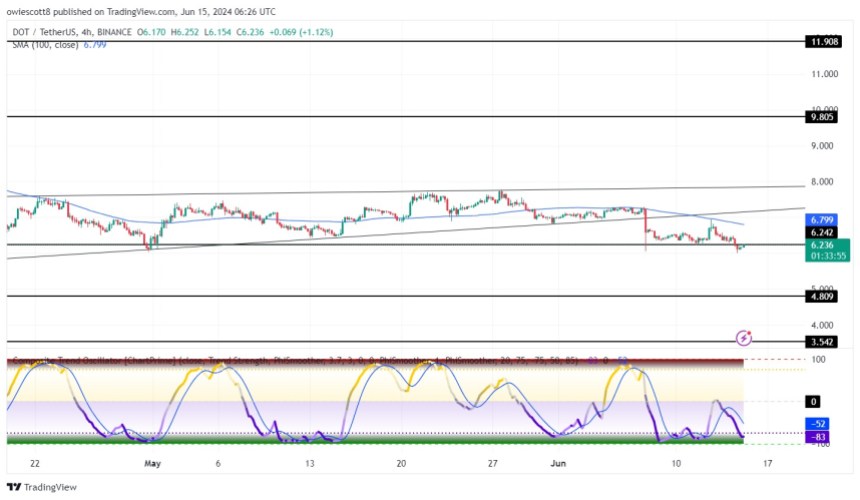
The formation of the 4-hour Composite Trend Oscillator also suggests that the price of DOT may still decline, as the indicator’s signal line and Simple Moving Average (SMA) are currently close to the oversold zone.
Also, on the 1-day chart, DOT is trying to make a bullish move below the 100-day SMA after dropping a bearish candlestick last day. Based on the price formation over one day, it can be suggested that this bullish move that DOT makes is only short-lived.
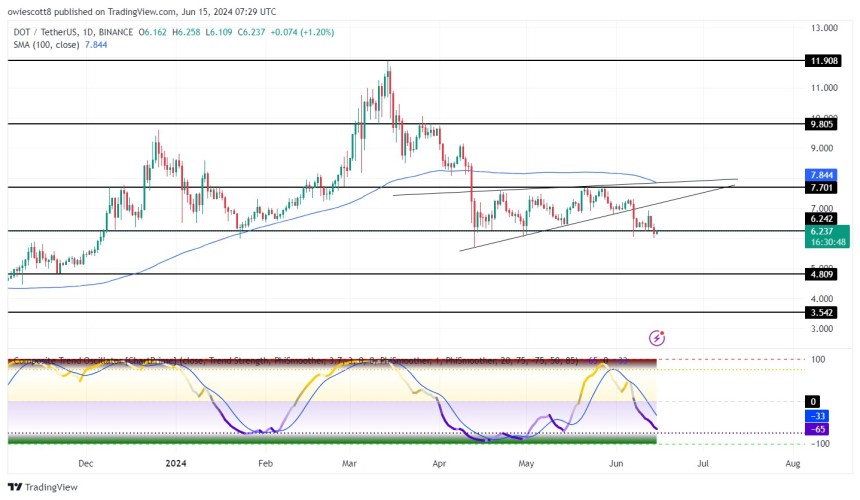
Finally, the 1-day Composite Trend Oscillator on the daily chart indicates that DOT price is still actively bearish as both the signal line and SMA have crossed below the zero line and are heading towards the oversold zone.
More losses ahead?
In conclusion, Polkadot is currently in a precarious position as it experiences a sharp and sustained decline, triggering a bearish alert. Therefore, if the price of DOT continues to decline, it could move towards the USD 4,809 support level. And if it falls below this level, it will fall further to test the USD 3,542 support level and probably others most important levels subsequently.
However, if DOT decides to continue its move in an upward direction, it will start moving towards the $7,701 resistance level. Should it break above this level, it will move higher to test the $9,805 level and likely turn bullish to test other key levels.
At the time of writing, DOT was trading around $6.23 and down 2.58% with a market cap of over $8.9 billion and a 24-hour trading volume of over $204 million. Although the market capitalization has fallen by 2.52%, trading volume has increased by 19.08% over the past day.
Featured image from Adobe Stock, chart from Tradingview.com