

The Chainlink price has been trading in a narrow range lately, leading to diminished investor interest. However, in the past 24 hours, the altcoin managed to experience a 1.5% increase, indicating a sideways move.
On the weekly chart, LINK showed a 4% upward move. Despite these gains, the technical analysis indicates that the bears are still controlling the price action. Both demand and accumulation levels remain low, although buying activity on the daily chart has increased slightly. Yet sellers still dominate the market.
Bitcoin’s price drop below $27,000 has created uncertainty among altcoins, preventing them from making decisive moves on their respective charts. After a period of consolidation, a price breakout is possible.
While the technical outlook suggests bearish strength, there are also signs of a possible reversal. However, for LINK to initiate a price recovery, it will depend on broader market strength, as evidenced by the decline in LINK’s market capitalization, reflecting its weak purchasing power.
Chainlink Price Analysis: One Day
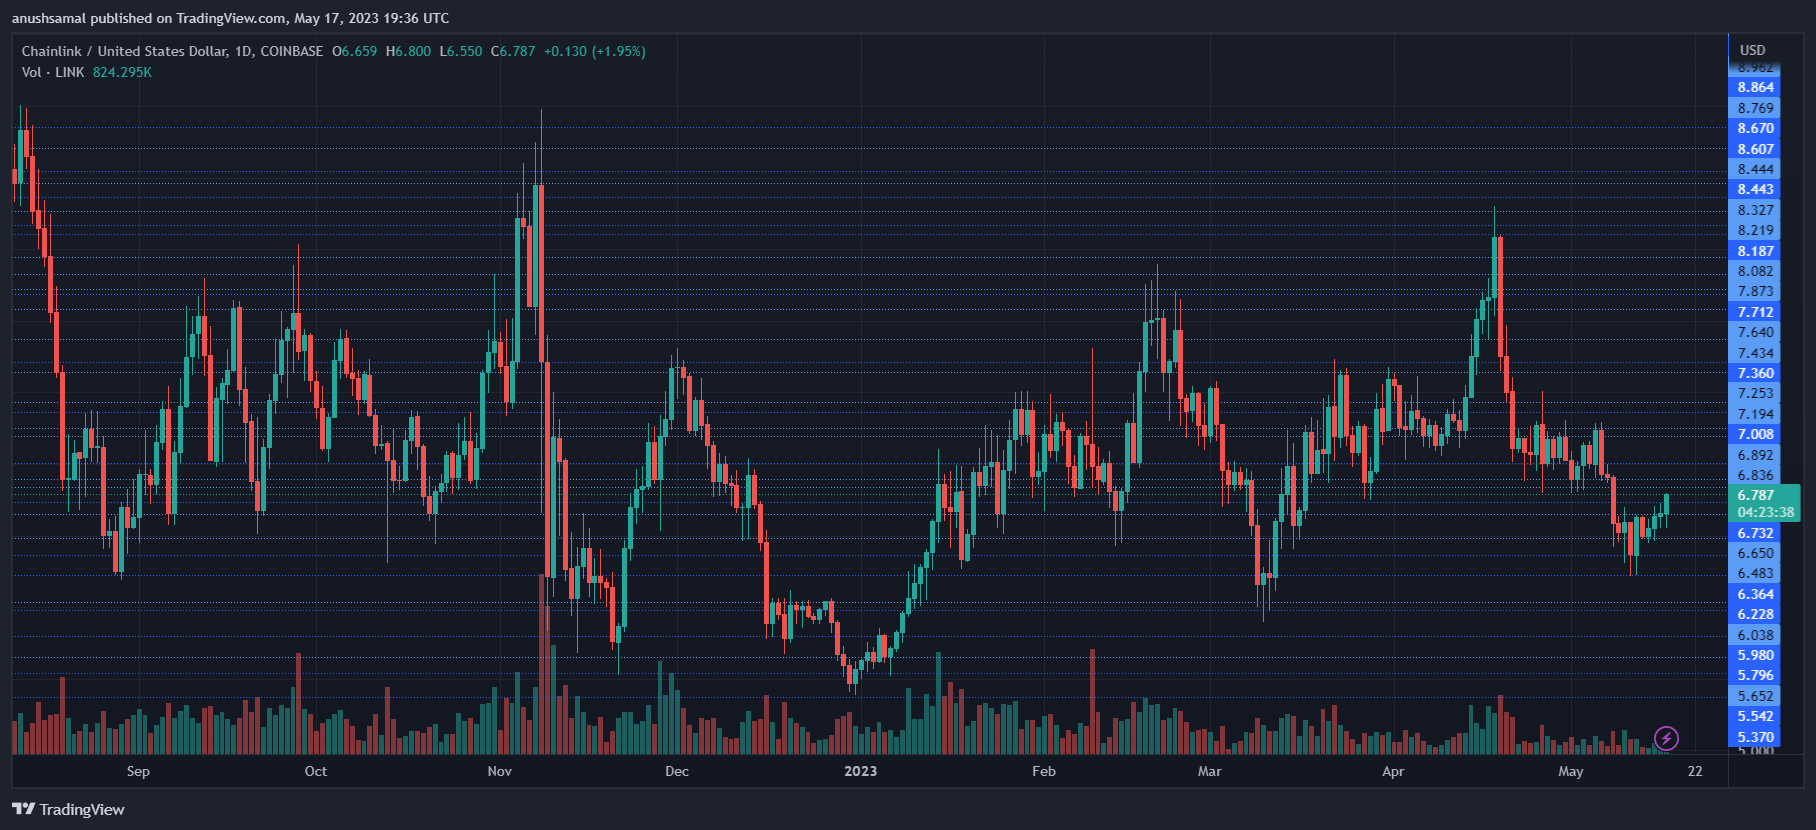
At the time of writing, the price of LINK was at $6.78 as it attempted to break its sideways trading pattern while staying below its $6.90 resistance level. A successful break above $6.90 could potentially trigger a rally towards $7.20.
Conversely, if the price declines from its current level, it could drop towards USD 6.30. A break of the $6.30 support line could push the price below $6.
On the other hand, as long as LINK remains above the local support line at $6.60, it has the potential to continue its recovery on the chart. Chainlink’s traded volume in the previous session was positive, indicating that buyers have begun to enter the market again.
Technical analysis
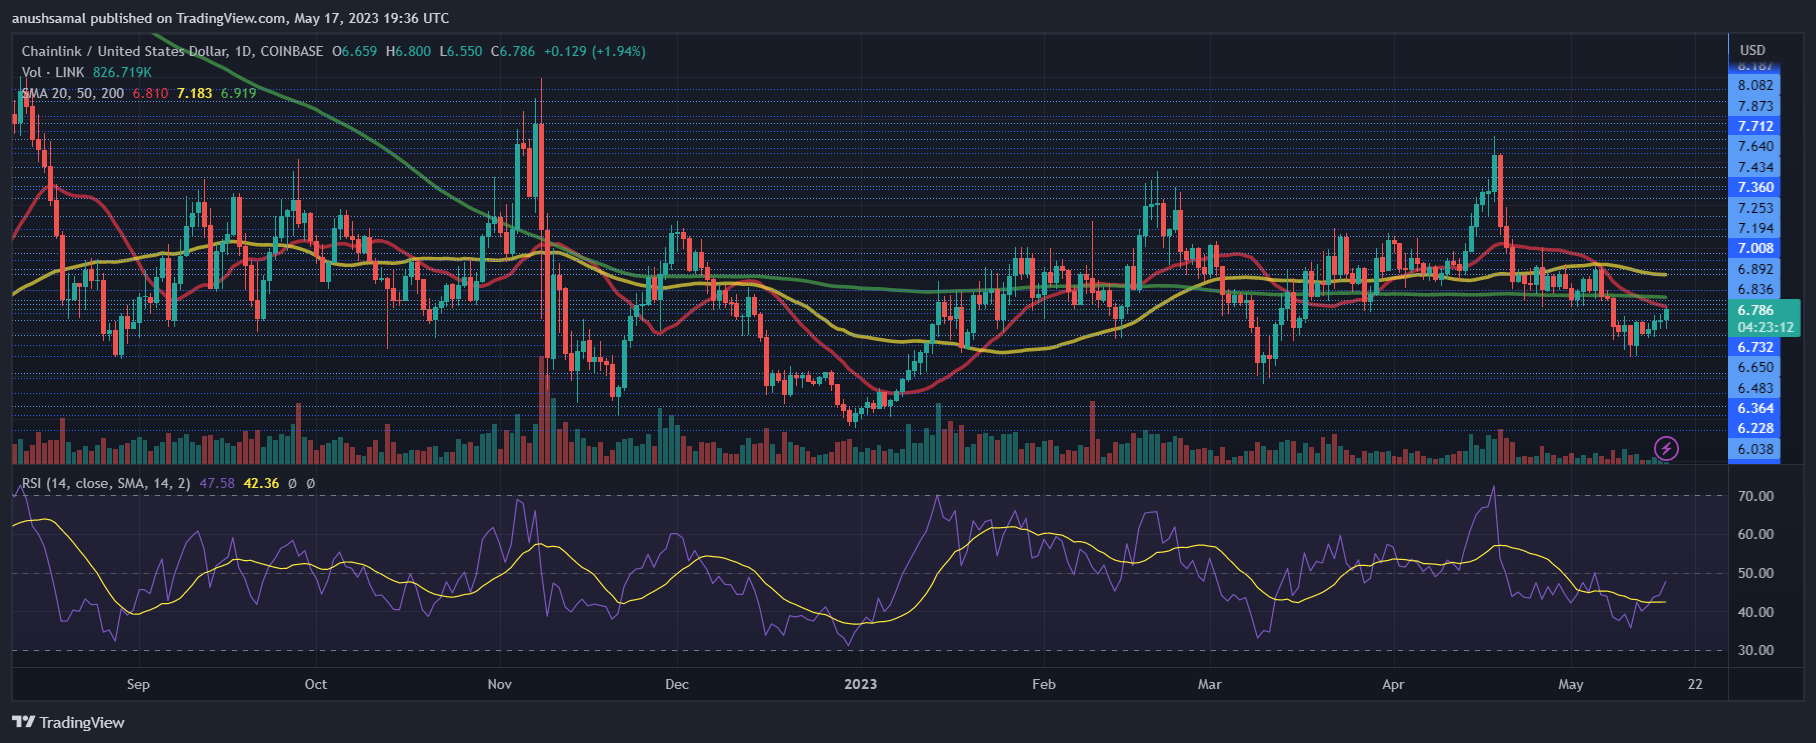
After continued sales pressure, LINK is now trying to lure buyers back to the market. The Relative Strength Index (RSI) is on an upward trend, almost halfway. At the moment, however, there are still more sellers than buyers.
In addition, LINK is attempting to trade above the 20-Simple Moving Average (SMA) line, indicating renewed demand in the market. Despite the coin’s recovery efforts, sellers are still driving overall price momentum.
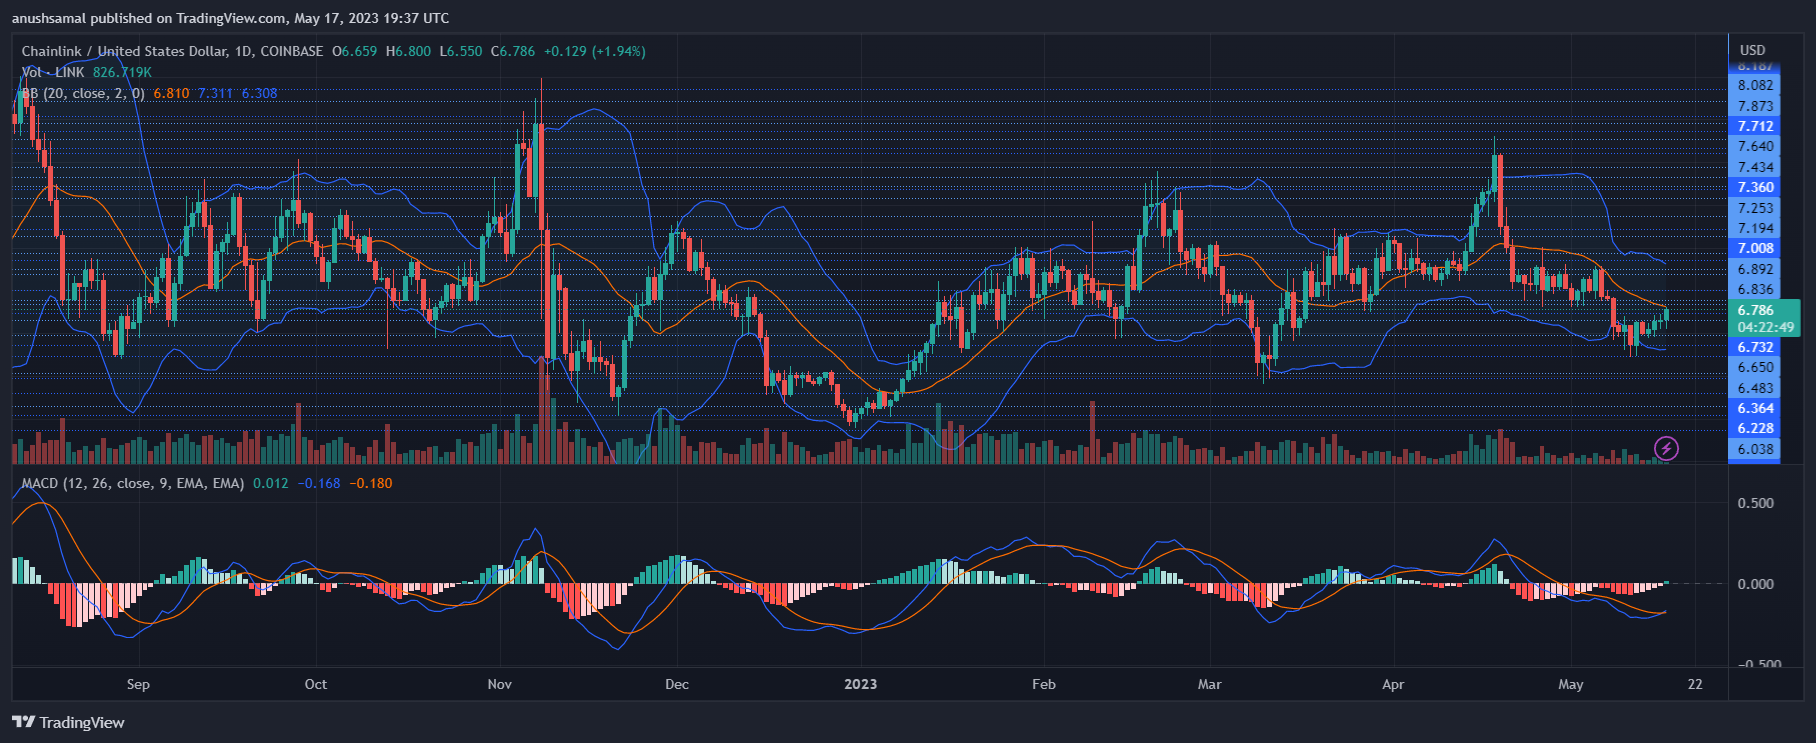
A buy signal emerged as LINK’s price and buying power turned to recovery. The Moving Average Convergence Divergence (MACD), a tool that reflects price momentum and potential trend reversals, formed a green signal bar aligned with a buy signal.
This indicated a potential for positive price movements. In addition, the Bollinger Bands were wide and parallel, suggesting that the coin was likely trying to escape its previous consolidated price action.
Featured image from Gadgets360, charts from TradingView.com