- Tron’s recent price action paints a promising picture for the medium term, with potential for further gains as long as key support levels hold.
- Given the nature of the current pattern, a near-term pullback is likely.
TRON [TRX] has been on an impressive uptrend over the past six months, witnessing a remarkable rally as it broke through key resistance levels.
At the time of writing, TRX was trading at nearly $0.2 above the 20, 50, and 200-day EMAs. Let’s take a closer look at the technical indicators to determine if TRX bulls can maintain momentum or if a correction is on the way.
Could TRX enter a price discovery phase to find a new ATH?


Source: TradingView, TRX/USDT
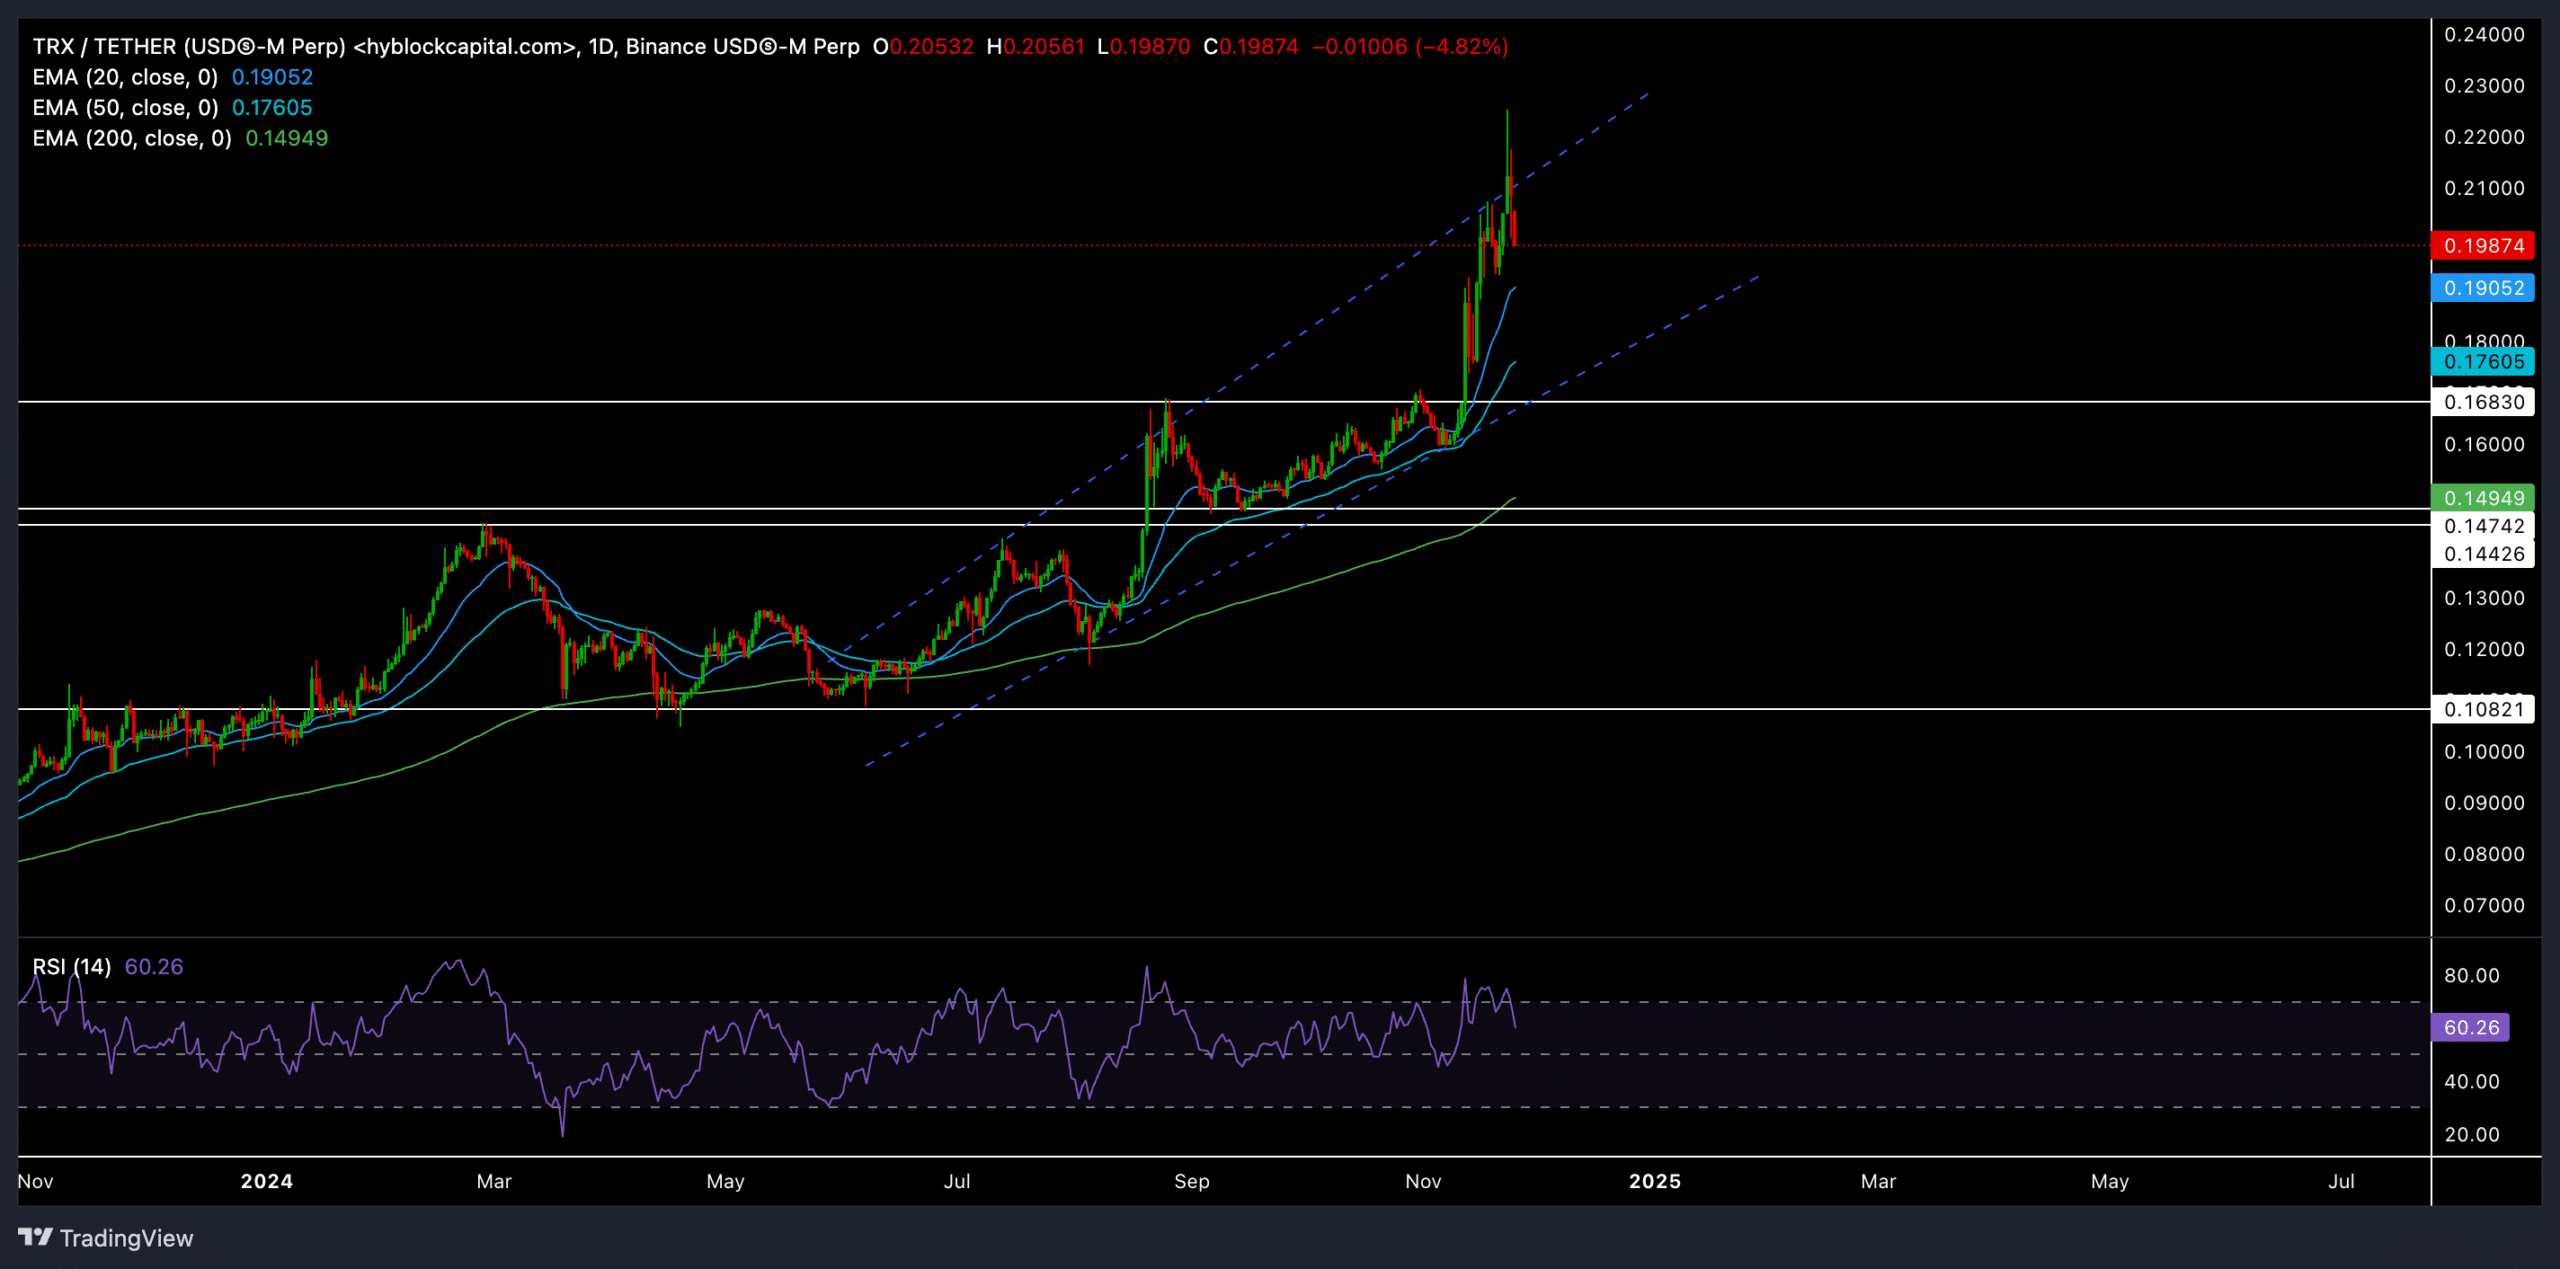
Tron recently broke through its $0.16 resistance level, leading a steep rally towards the $0.22 zone – close to the ATH level on November 23. Over the past six months, TRX has posted consistent gains amid strong bullish sentiment in the broader market.
TRX consolidated after a smooth uptrend to form a rising, broader wedge on the daily chart. This pattern could lead to further gains in the current market-wide bull run, provided the price contains key support areas and confirms another upside breakout.
The first major support level was around the 20-day EMA at $0.19. Buyers should pay attention to a possible retest in this area. Holding this level could confirm bullish strength and keep TRX on its current trajectory.
A further decline towards the $0.17 region (in line with the 50-day EMA) is possible amid a broader market decline or bearish sentiment.
The immediate resistance level is around $0.22. A close above resistance of the current bullish pattern could push TRX into a price discovery phase, potentially setting off a steeper uptrend in the coming days.
The RSI was around 62, indicating a lead for the bulls. However, a dip towards 50 could be a sign of a short-term consolidation phase.
TRX derivative data revealed THIS


Source: Coinglass
TRX derivatives data showed a recent decline, with trading volume down 35.73% to $273.77 million and open interest down 4.47% to $138.26 million. This means traders take a pause to reconsider their positions, leading to a pause in the bullish trend.
Read TRON’s [TRX] Price forecast 2024-25
The long/short ratio for TRX stood at 0.9693, meaning market sentiment was balanced, but slightly in favor of the bears. The TRX/USDT long/short ratio on Binance is 1.7064, indicating that some top traders still expect prices to rise.
Traders should also keep an eye on broader market movements, especially those of Bitcoin, which could have a significant impact on TRX’s price trajectory. Any renewed bullish sentiment in the market could send TRX back into its rally mode.

