Solana (SOL) has been in a challenging correction phase for about two months, with its fortunes going up and down. The most recent dip, which occurred on August 15, was in direct response to a sudden drop in the price of Bitcoin, sending shockwaves through the crypto market. However, closer examination of Solana’s price chart reveals an inverse head and shoulders pattern.
For those unfamiliar with the inverse head and shoulders pattern, it is a technical chart formation that signals a potential trend reversal. It consists of three major components: a lower low (the head) with two higher lows on either side (the shoulders), forming an inverted “T” shape. This pattern generally indicates a shift from a bearish trend to a bullish trend, making it an attractive prospect for investors.
Solana appears to be outlining this intriguing configuration, hinting at the possibility of a significant increase in price. However, the realization of this bullish scenario largely depends on the situation SOL’s net worth to break a crucial point of resistance known as the neckline.
Solana’s potential trajectory
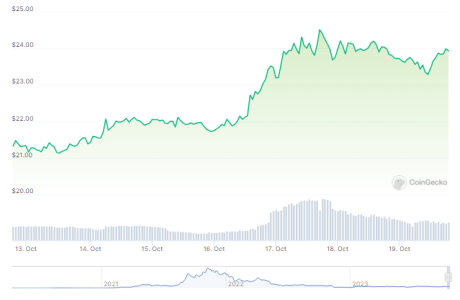
According to the most recent data available at Coin gecko, Solana (SOL) is currently trading at $23.79. Over the past 24 hours, the cryptocurrency saw a slight decline of 0.6%, while it had a seven-day rally of 9.9%. These fluctuations reflect the ongoing battle between buyers and sellers, each vying for control of SOL’s price trajectory.

SOL seven-day price movement. Source: Coingecko
SOL: from support to vulnerability
Solana has come a long way from the USD 22.38 support level, providing an opportunity for sellers to put pressure on the cryptocurrency. If the selling pressure continues, price predictions indicate that SOL could fall another 12% and possibly reach a price of $18.8. The fragility of the market underlines the need for a cautious approach, both for existing investors and potential buyers.
A closer examination of the daily timeframe chart reveals a clear downward trend that characterizes the cryptocurrency’s ongoing correction phase. Sellers will likely continue to exploit any resistance points during bullish rebounds, making it essential for investors to be cautious.
As of today, the market cap of cryptocurrencies stood at $1.06 trillion. Chart: TradingView.com
As the market continues its downward trend, potential buyers are advised to exercise patience. The best strategy might be to wait until the neckline resistance is broken, which signals a trend change. Timing remains of the utmost importance and investors must be prepared to act when conditions are favorable.
Solana’s journey through the correction phase has been a rollercoaster ride for investors. Amid ongoing market fluctuations, staying informed and cautious is essential for both existing and potential investors in SOL.
(The content of this site should not be construed as investment advice. Investing involves risks. When you invest, your capital is subject to risk).
Featured image from PYMNTS

