

- Solana is approaching key resistance at $160.70 as strong volume supports momentum.
- Liquidation data indicates a possible short squeeze, increasing bullish pressure.
Solana [SOL] has experienced an upside and was trading at $151.10, marking a 3.54% increase in value at the time of printing. As the token approaches critical resistance levels, the question remains whether SOL can maintain this upward momentum and ignite a broader rally.
Price Action: Will SOL Break Key Levels?
Solana’s price is moving towards significant resistance at $160.70, while support remains firm at $147.49. Solana is trading near the upper Bollinger Band, indicating potential for further gains.
Additionally, the Relative Strength Index (RSI) stands at 55.04, indicating that the market is still in a healthy position without being overbought.
If Solana can break the resistance at $160.70, it could open the door for more upside movement. However, failure to break through this level could lead to consolidation or even a pullback.
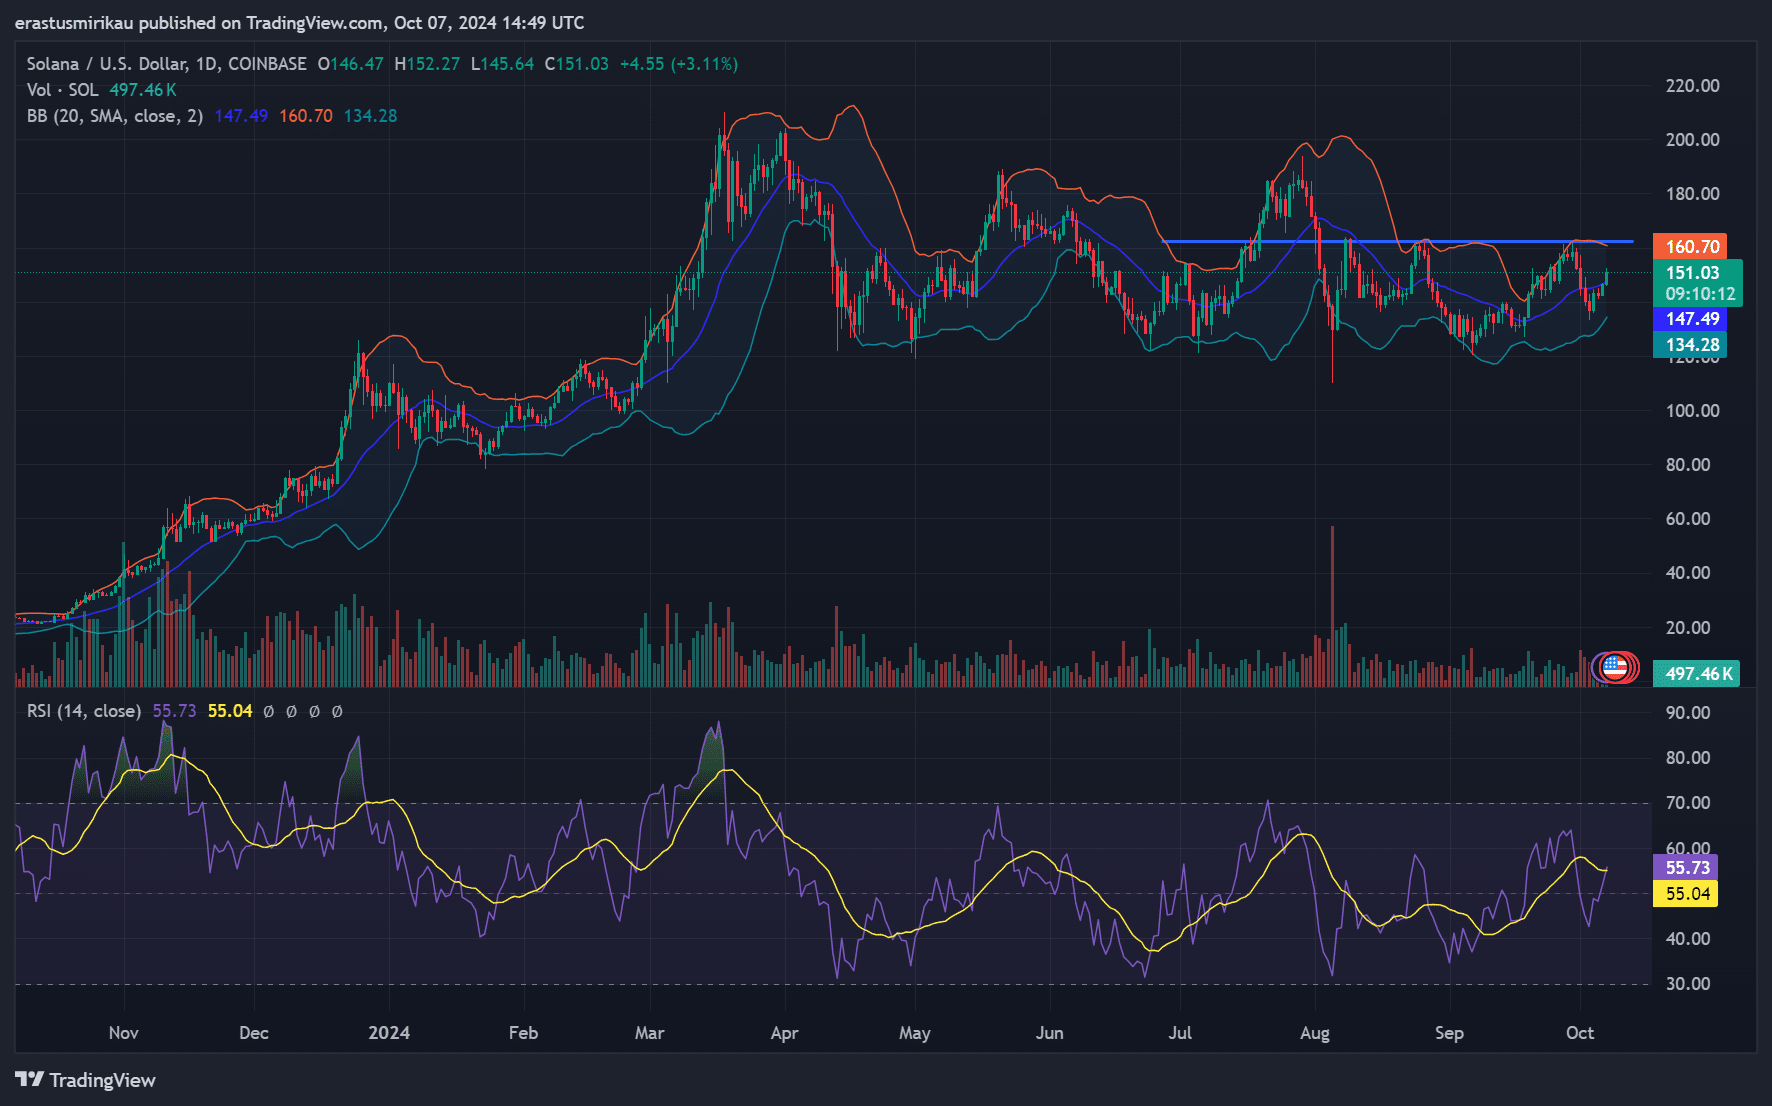
Source: TradingView
SOL Volume Rise: A Sign of Momentum?
The recent 127.64% spike in trading volume is a crucial development for Solana. Increased volume often indicates strong market interest, which can drive up prices. Consequently, this increase in activity can help SOL overcome its resistance.
Traders should be careful, however, as high volume alone does not always guarantee sustainable price movement without breaching key levels.
Long/short ratio: what do traders think?
Solana’s long/short ratio currently stands at 50.33% long and 49.67% short, indicating that traders are almost evenly split. However, the slight preference for long positions indicates marginally bullish sentiment.
As Solana approaches resistance, this ratio could change dramatically, especially if the price moves higher, which could attract more buyers to the market.
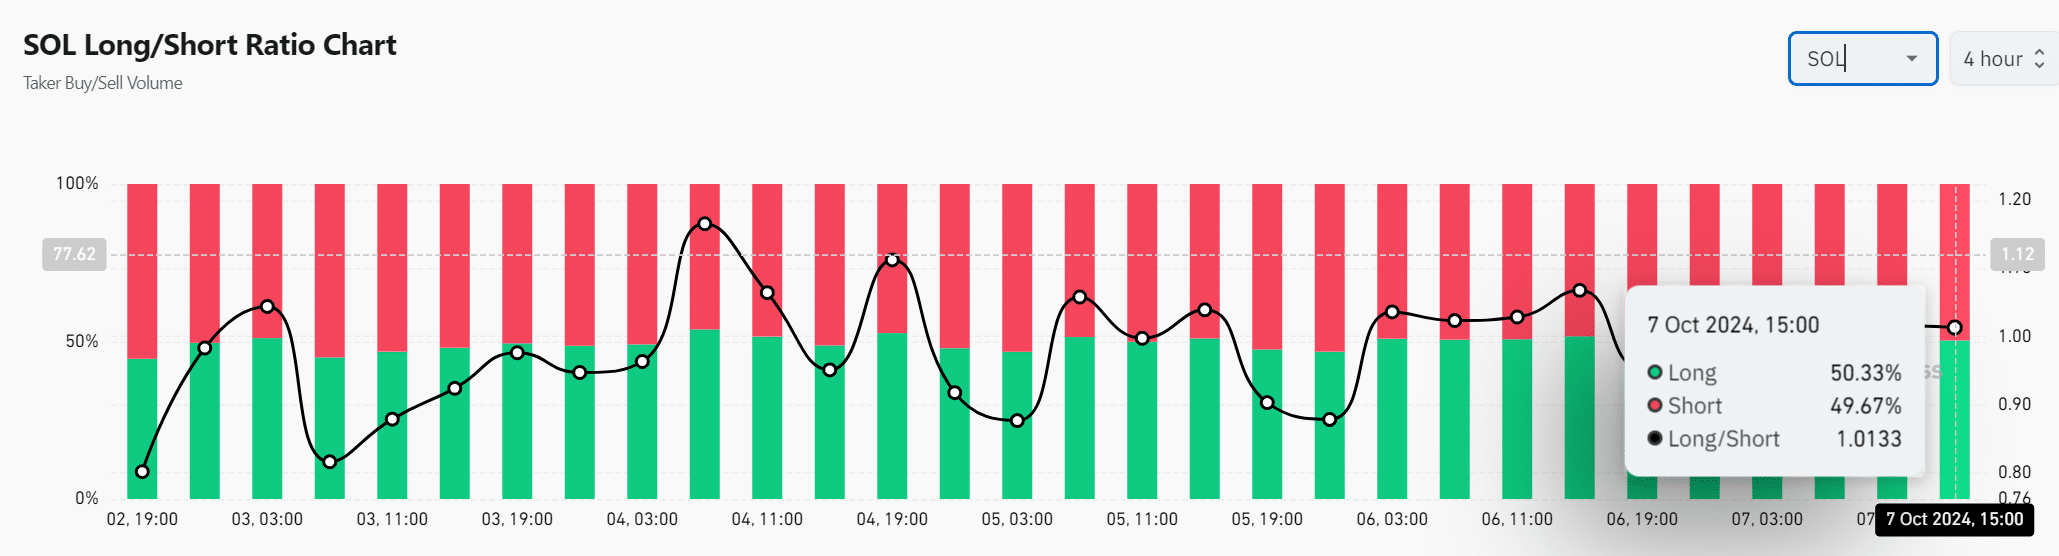
Source: Coinglass
Liquidations: Could Shorts Come Under Pressure?
Liquidation data shows that $4.94 million of short positions were liquidated, compared to $1.26 million of long positions. This imbalance could fuel further upward momentum if short positions remain under pressure.
Therefore, if Solana’s price continues to rise, it could force more shorts out of the market, increasing buying pressure.
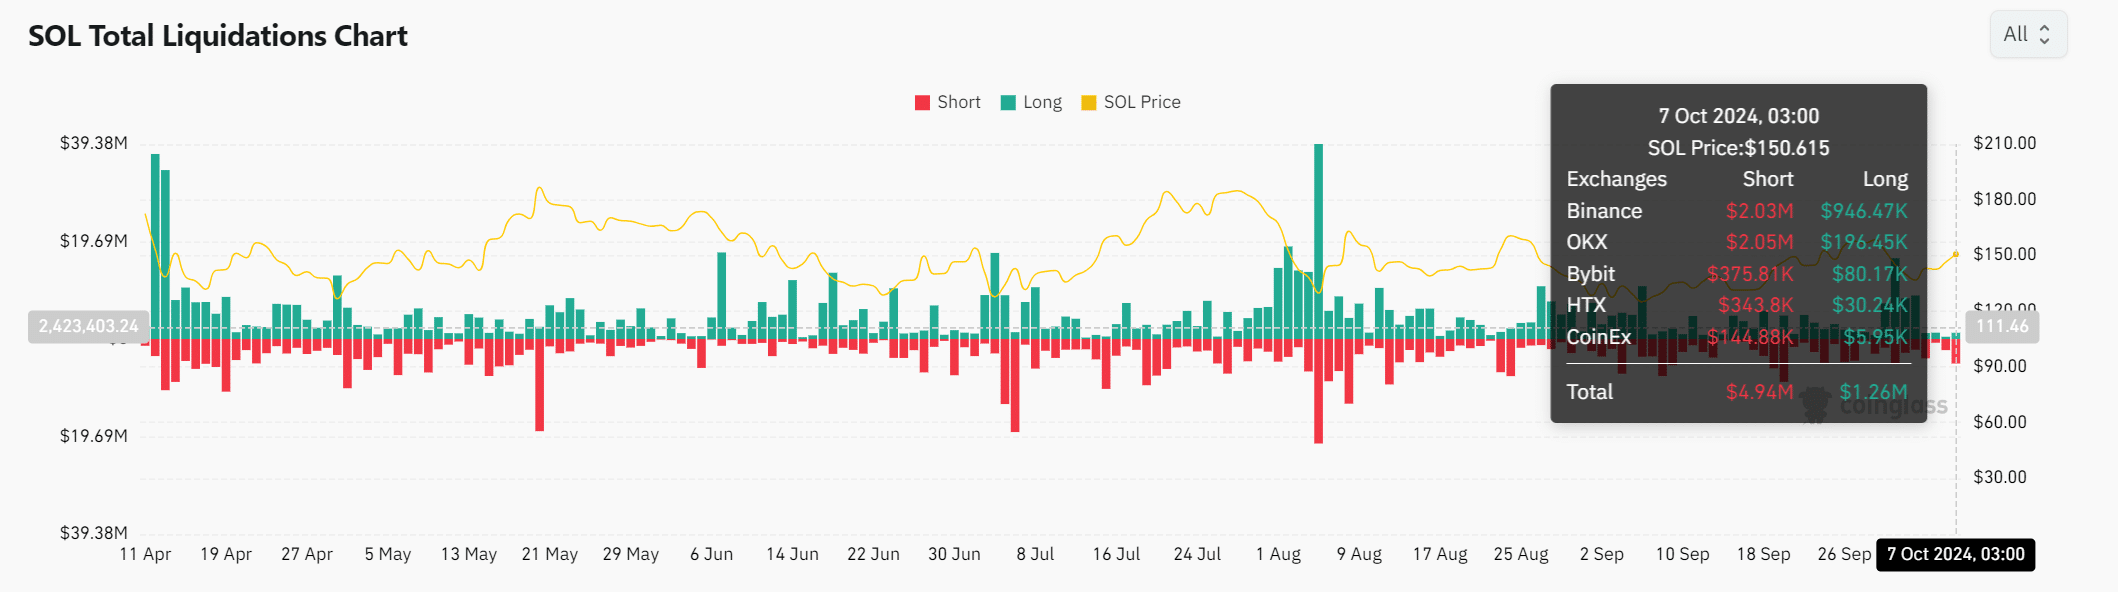
Source: Coinglass
Read Solana’s [SOL] Price forecast 2024–2025
In short, while Solana is showing strong bullish signals, it needs to decisively break the USD 160.70 resistance to unleash a more substantial rally.
Therefore, traders should keep an eye on volume and liquidation data to gauge the likelihood of this breakout.