

- A whale has released 594,000 SOL since January, putting pressure on Solana’s already volatile price movements.
- Solana’s Head and Shoulders pattern indicates a possible drop to $122, raising concerns among traders.
Solana [SOL] has experienced volatility in recent trading sessions, reflecting mixed market sentiment. The price of SOL has fluctuated between key resistance at $150.00 and support around $142.00, showing consolidation within this range.
At the time of writing, Solana was trading up $145.84This represents a decline of 1.11% in the past 24 hours, despite an increase of 3.08% in the past week. With a circulating supply of 470 million SOL, the current market capitalization is estimated at $68.16 billion.
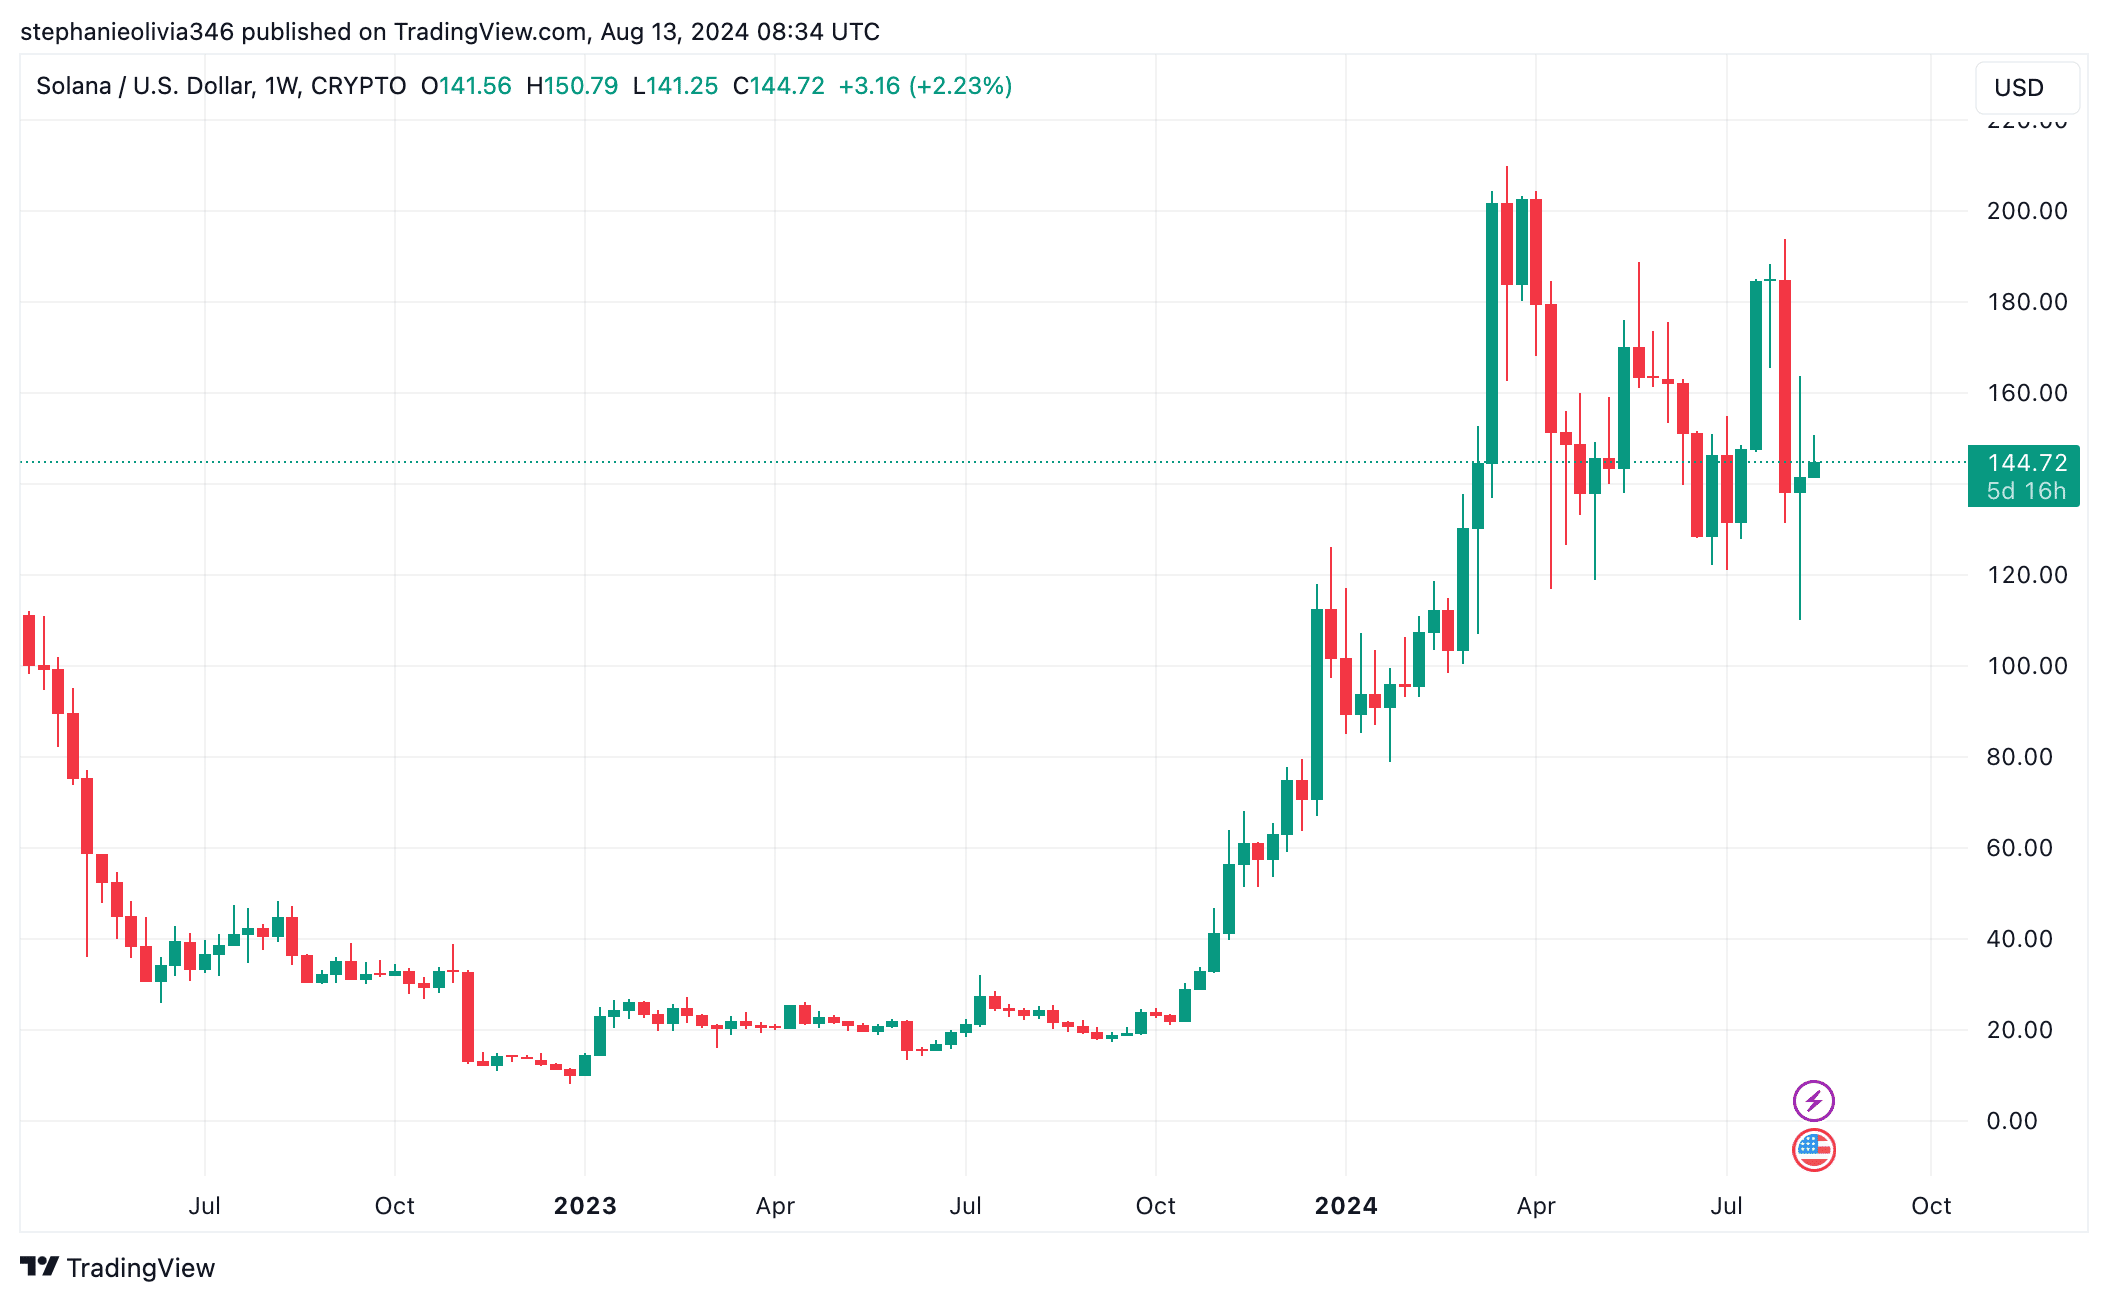
Source: TradingView
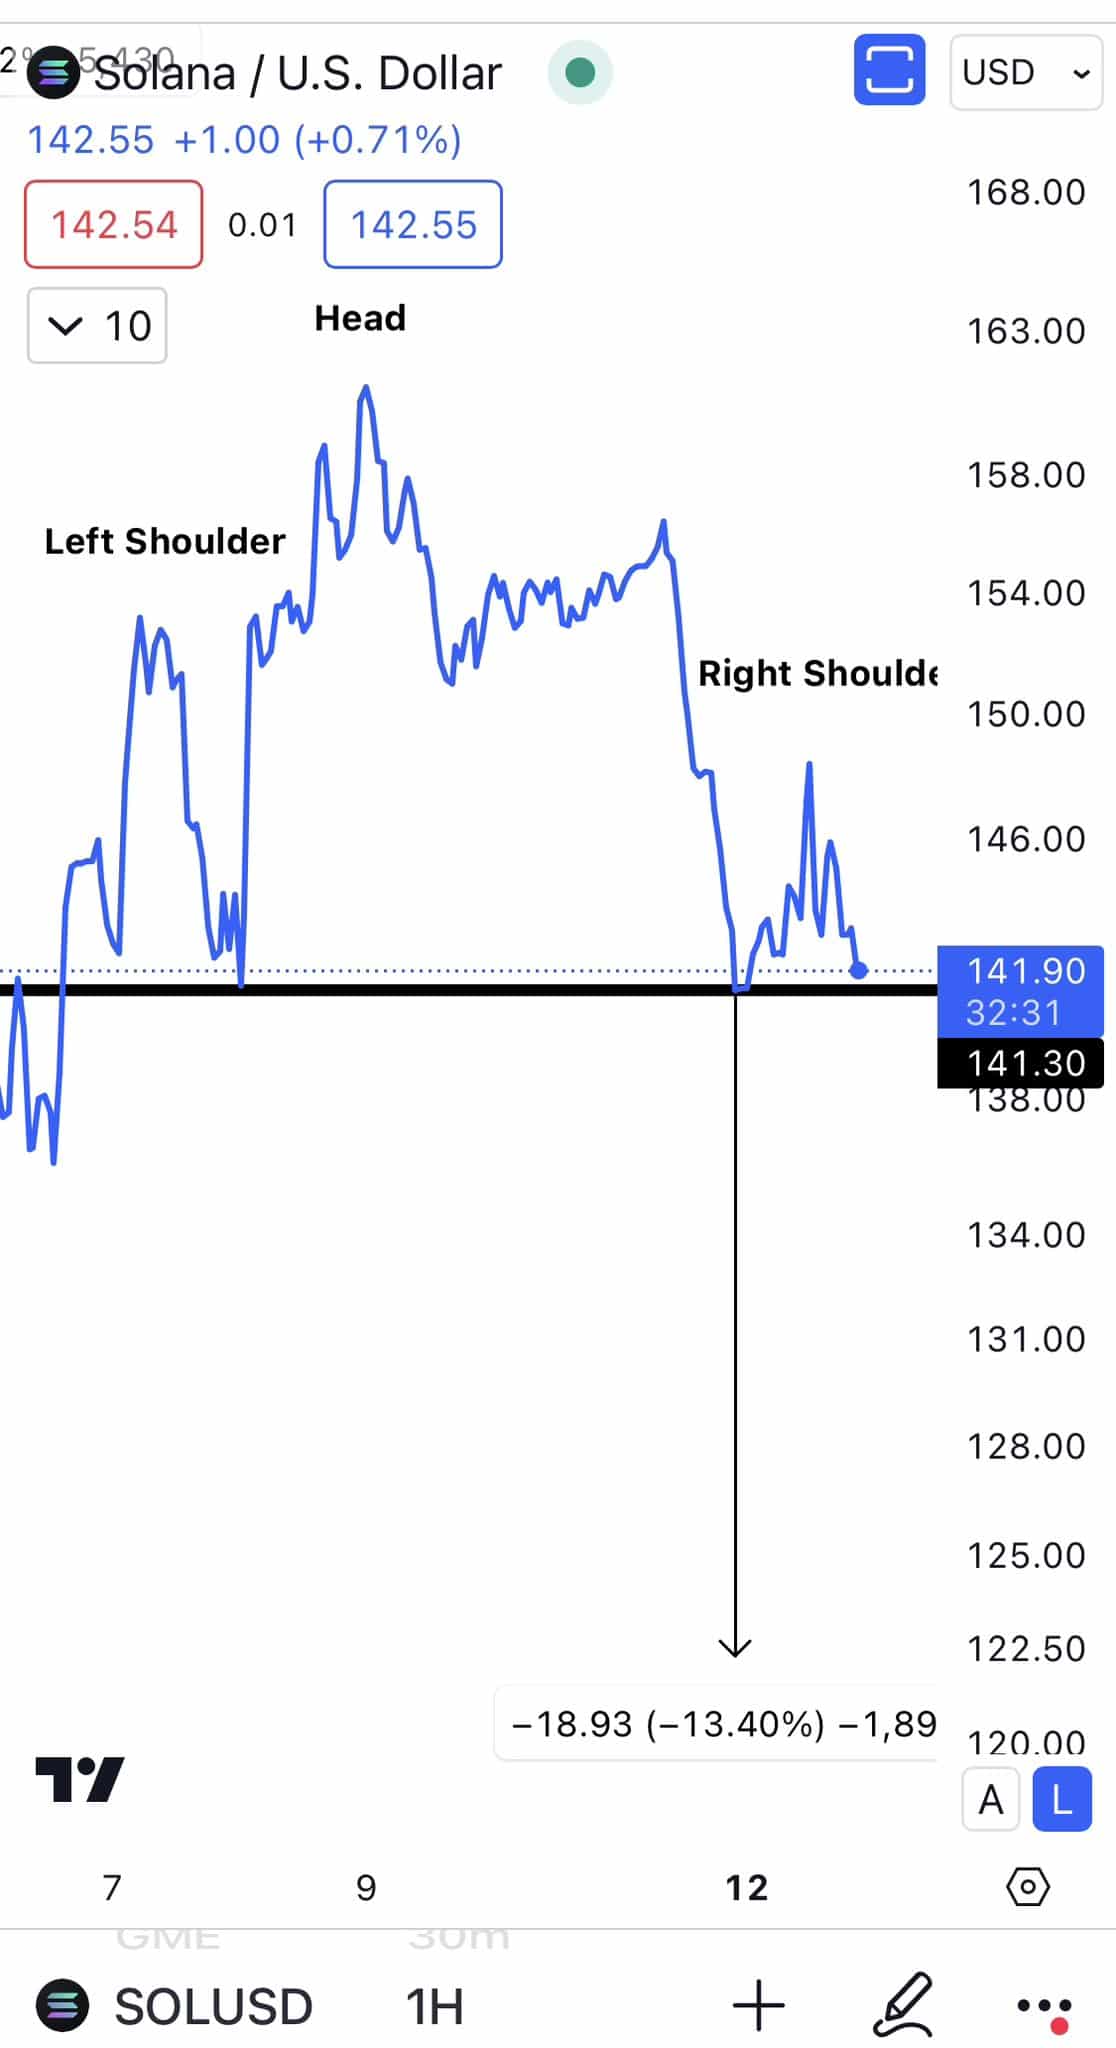
Meanwhile, technical analysis suggests that Solana may form a head-and-shoulders pattern on the hourly chart. According to a recent statement by Ali on X, this pattern could indicate an impending price correction.
Ali stated:
“Solana could form a head-and-shoulders pattern on the hourly chart, suggesting that a drop below $141 could trigger a correction that sends SOL towards $122.”
The pattern’s neckline, around $141.90, serves as a crucial level. If the price breaks below this support, it could confirm the pattern, leading to further downward pressure.
The potential target for this bearish move is estimated at $122.50, which represents a decline of 13.40% from the neckline.
Source:
Whale activity and market dynamics
Solana’s recent price action could also be affected by significant whale activity. A report from Lookonchain on X revealed that a whale has sold 594,000 SOL since January 2024, which amounts to $86 million.
The sales were consistent, with the whale depositing large amounts of SOL on major exchanges including Coinbase, Binance and OKX, with an average sales rate of one sale per week.
The last sale took place just 16 hours ago.
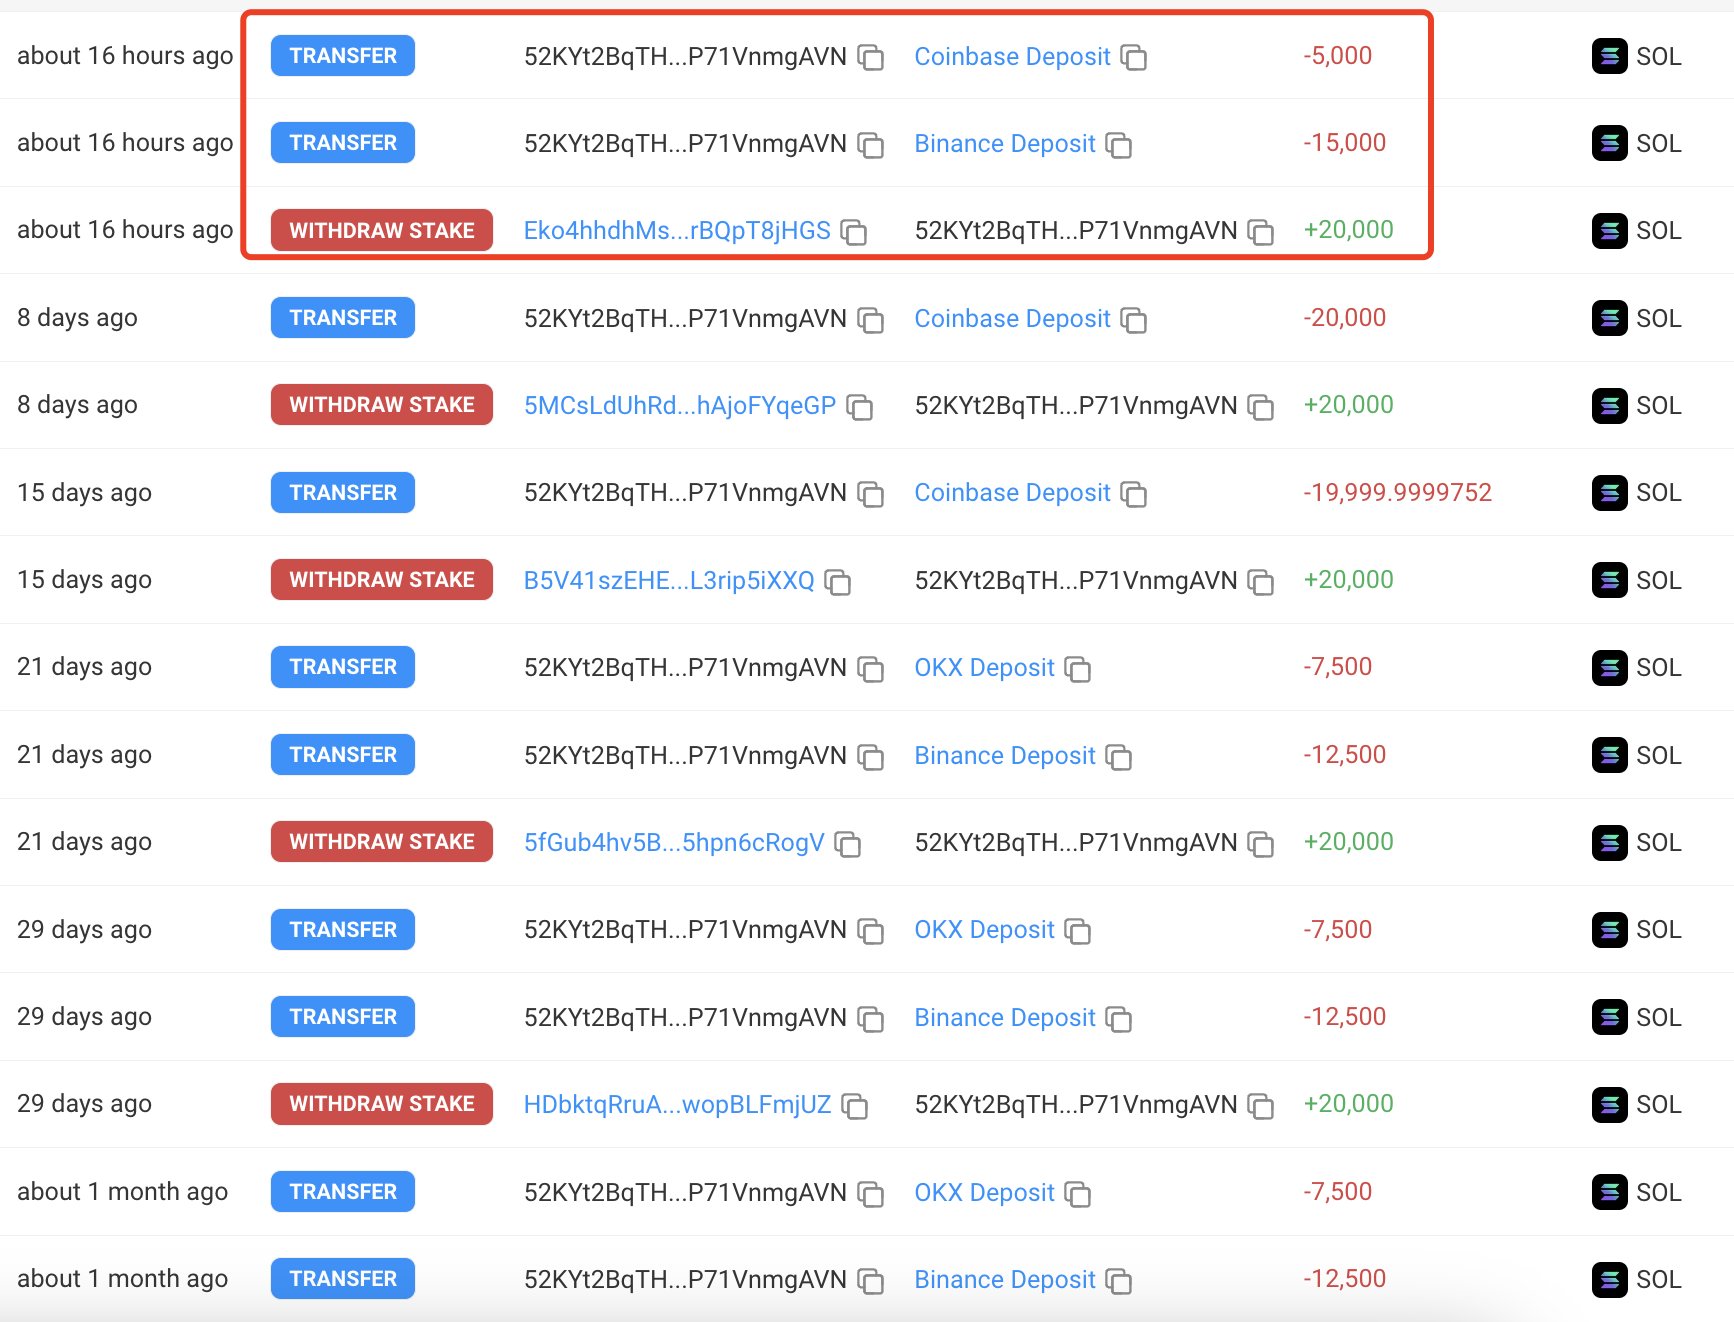
Source: Solscan
In fact, this steady unloading of SOL by a large holder could contribute to downward pressure on assets, raising market stability concerns.
Concerns have been raised about Solana’s network and activities
In addition to market activities, discussions have arisen about Solana’s network functionality and governance. In a series of posts, Dave outlined several issues that could affect the long-term prospects of the network.
These include frequent failed transactionsled by bots and RPC endpoints, and concerns about Solana’s validator requirements, which reportedly favor wealthier participants.
Additionally, Dave highlighted that Solana’s transaction per second (TPS) metrics can be misleading because the network includes votes and failed transactions in its TPS calculations, leading to an inflated figure.
Furthermore, Solana’s circulating supply has increased by 59.09 million over the past year, raising questions about the sustainability of the current market valuation.
Potential price movements and liquidity problems
AMBCrypto has observed a liquidity pocket around the $140 level, which could pull prices lower. This area has previously served as a turning point, as seen on August 7.
Is your portfolio green? View the Solana Profit Calculator
However, the lack of demand and prevailing bearish momentum could push Solana below $140, potentially leading to a further decline towards $130 or even lower.
Traders are advised to keep a close eye on these developments as the combination of technical signals, whale activity and network issues could impact Solana’s price trajectory in the short term.