

UNI price is moving higher after the $6.00 support. Uniswap is up 5% and could rise if there is a clear move above the $6.35 resistance zone.
- UNI started with another increase from the $5.50 support zone.
- The price is trading above USD 6.00 and the 100 simple moving average (4 hours).
- A major bearish trendline is forming with resistance near $6.20 on the 4-hour chart of the UNI/USD pair (Kraken data source).
- The pair is showing bullish signs and could rise if it breaks the $6.35 resistance.
UNI price aims higher
After forming a support base above $5.65, UNI initiated another increase. There was a decent upward move in Uniswap above the USD 6.00 and USD 6.20 resistance levels.
However, the bears were active near the $6.35 zone. It reached a high of $6.33 before a downward correction. The price fell below the $6.20 level. There was a move below the 23.6% Fib retracement level of the upward move from the $5.53 swing low to the $6.33 high.
It tested the $6.00 support and the 50% Fib retracement level of the upward move from the $5.53 swing low to the $6.33 high. Uniswap rises above the $6.10 level again and outperforms Bitcoin and Ethereum.
The UNI price is trading above USD 6.00 and the 100 simple moving average (4 hours). The immediate resistance on the upside is near the $6.20 level. There is also a major bearish trendline forming with resistance around $6.20 on the 4-hour chart of the UNI/USD pair.
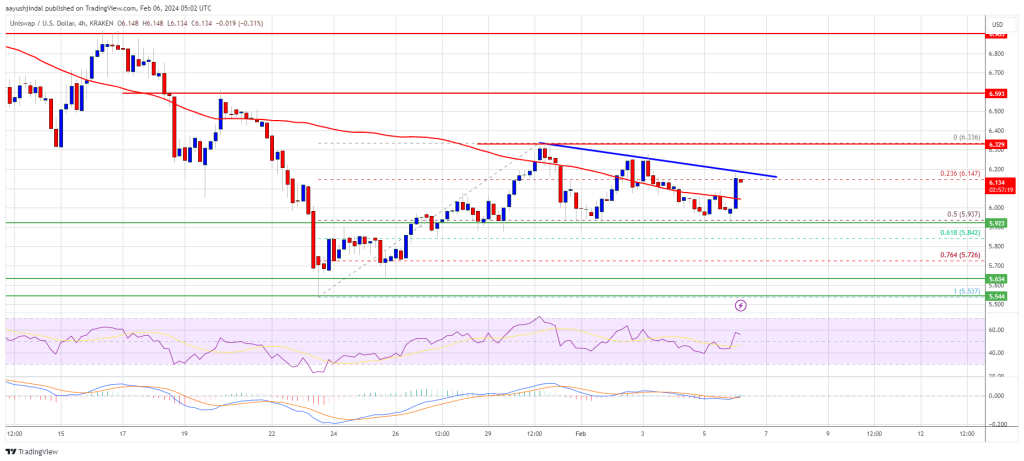
Source: UNIUSD on TradingView.com
The next major resistance is near the $6.35 level. A close above the $6.35 level could open the doors for more gains in the near term. The next major resistance could be around $7.00, above which bulls are likely to aim for a test of the $7.20 level. Any further gains could send UNI to $7.50.
Dips supported in Uniswap?
If UNI price fails to rise above USD 6.20 or USD 6.35, it could trigger another downside correction. The first major support is near the $6.00 level.
The next major support is near the $5.85 level. A downside break below the USD 5.85 support could open the doors for a push towards USD 5.50.
Technical indicators
4-hour MACD – The MACD for UNI/USD is gaining momentum in the bullish zone.
4-hour RSI (Relative Strength Index) – The RSI for UNI/USD is above the 50 level.
Major support levels – USD 6.00, USD 5.85 and USD 5.50.
Major resistance levels – $6.20, $6.35 and $7.00.
Disclaimer: The article is for educational purposes only. It does not represent NewsBTC’s views on buying, selling or holding investments and of course investing involves risks. You are advised to conduct your own research before making any investment decisions. Use the information on this website entirely at your own risk.