

Glassnode data shows that the structure of the current Bitcoin rally resembles the origins of historical upsides.
Bitcoin’s recovery since the November lows is reminiscent of previous rallies
In its latest weekly report, the on-chain analytics firm Glasnode has examined how the current Bitcoin rally compares to similar rallies the cryptocurrency has seen during previous cycles.
To make this comparison, the analytics company took data for the coin’s performance from its all-time high in each cycle.
Here’s a chart showing what past bear market rallies have looked like in terms of this metric:
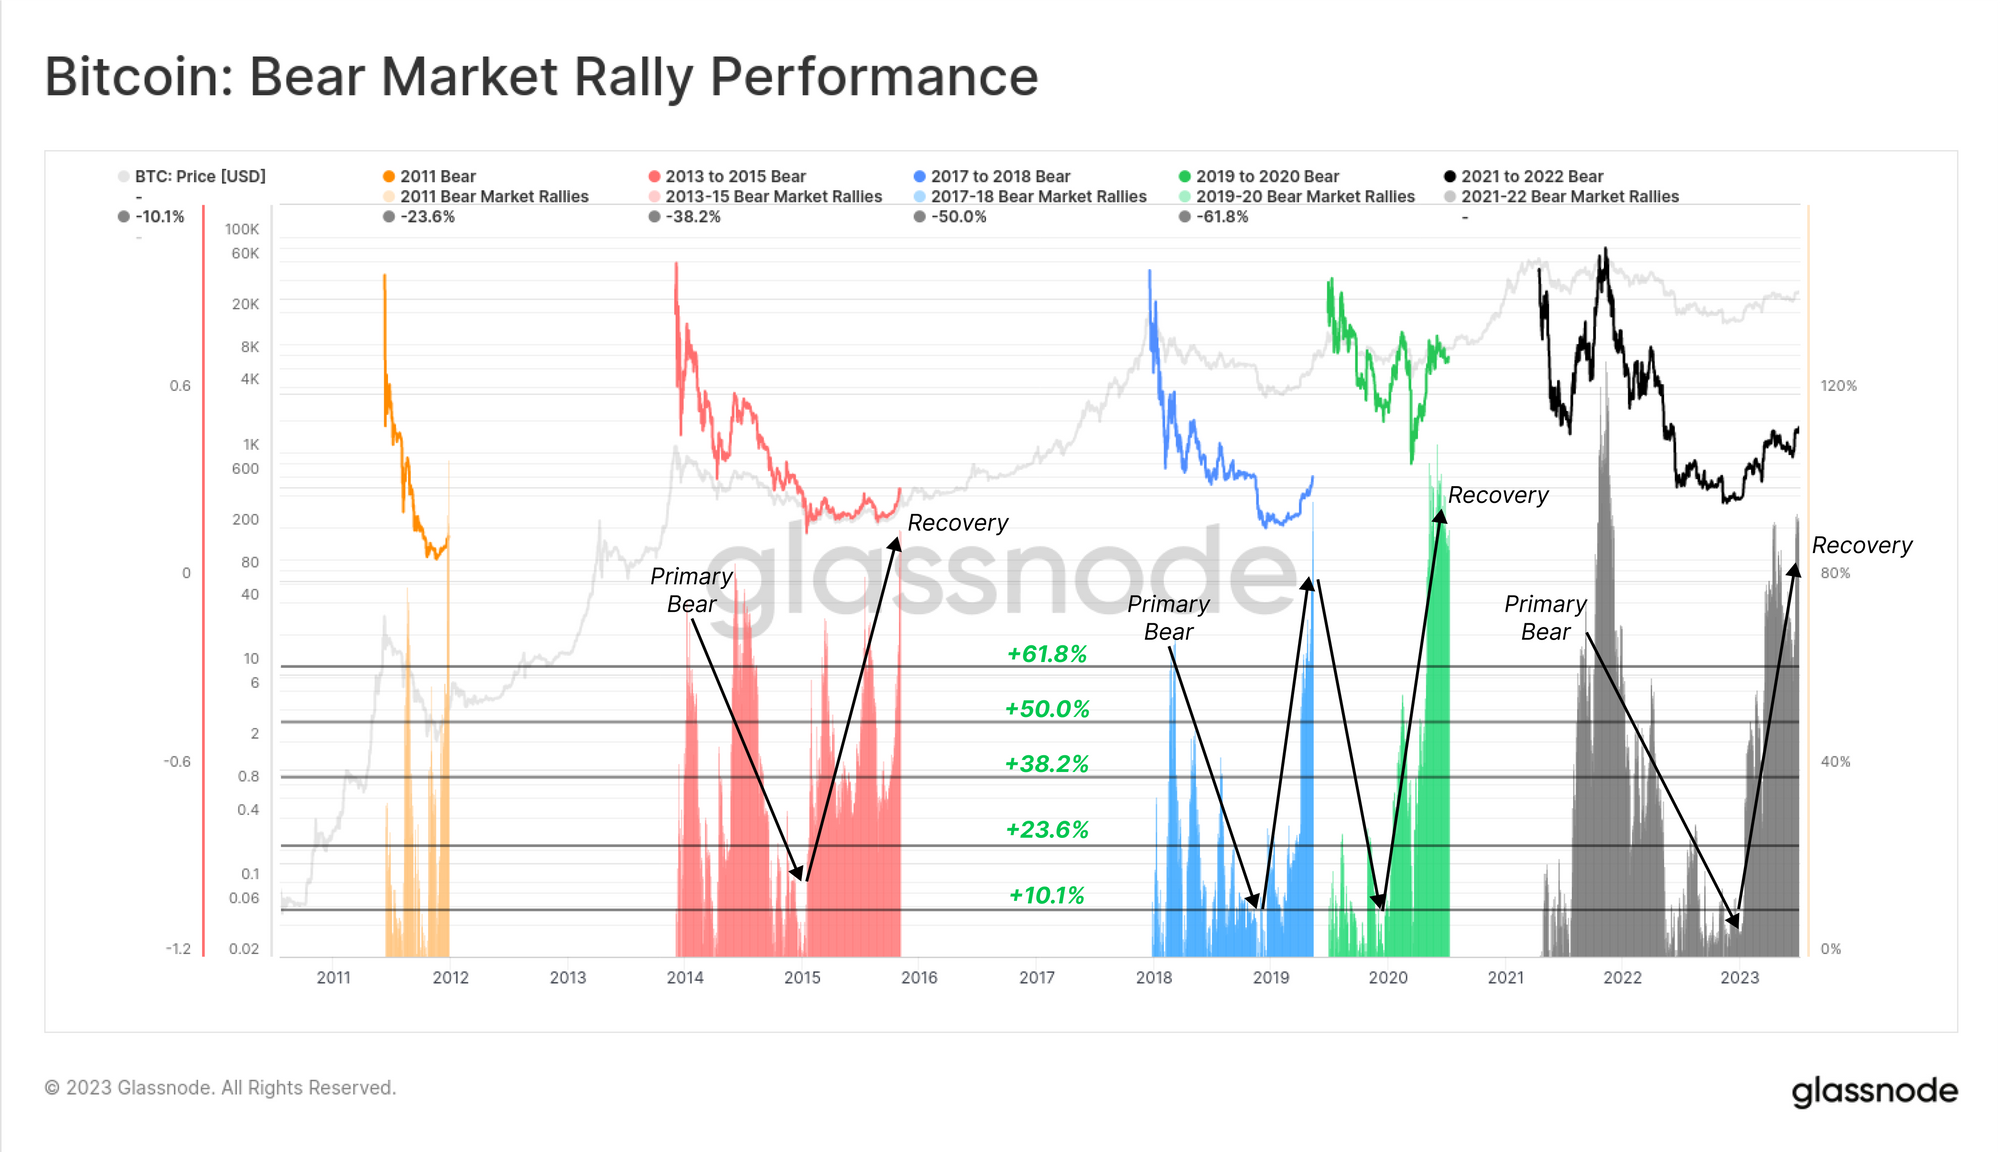
The bear market rally performance throughout the different cycles | Source: Glassnode's The Week Onchain - Week 28, 2023
Note that only Bitcoin’s upside performance is considered here and withdrawal is excluded. The chart shows that during all cycles, the gains after the ATH set disappeared in time as the bear market went into full swing.
Shortly after the bear bottom formation occurred, these cycles the asset experienced a recovery rally. In the current cycle so far, it is not yet entirely certain whether the November 2022 low after the FTX crash was indeed the cyclical low.
However, if it is assumed that this low was indeed the low, then the rally that has been going on for the past few months would assume the role of a recovery rally in the current cycle.
Interestingly, the cryptocurrency has seen a 91% increase so far since the aforementioned bottom, which is very similar in scale to the recovery rallies of past cycles.
“With the exception of 2019, all previous cycles, which traveled a similar extent from the bottom, were in fact the origins of a new cyclical uptrend,” explains Glassnode.
The reason 2019 was different is that the April 2019 rally (which normally acted as the recovery rally from the bear market bottom) quickly picked up steam and the price subsequently fell.
The recording was then extended in March 2020 when the crash due to the emergence of COVID-19 happened. It is the recovery rally from this crash that ultimately led to the 2021 bull market.
Of course, if the pattern of the first two Bitcoin cycles is anything to go by, the current structure of the recovery rally could mean that the asset is now on a cyclical uptrend.
The analytics company also viewed the rally from a different angle: this time in terms of the drawdown (that is, the negative performance).
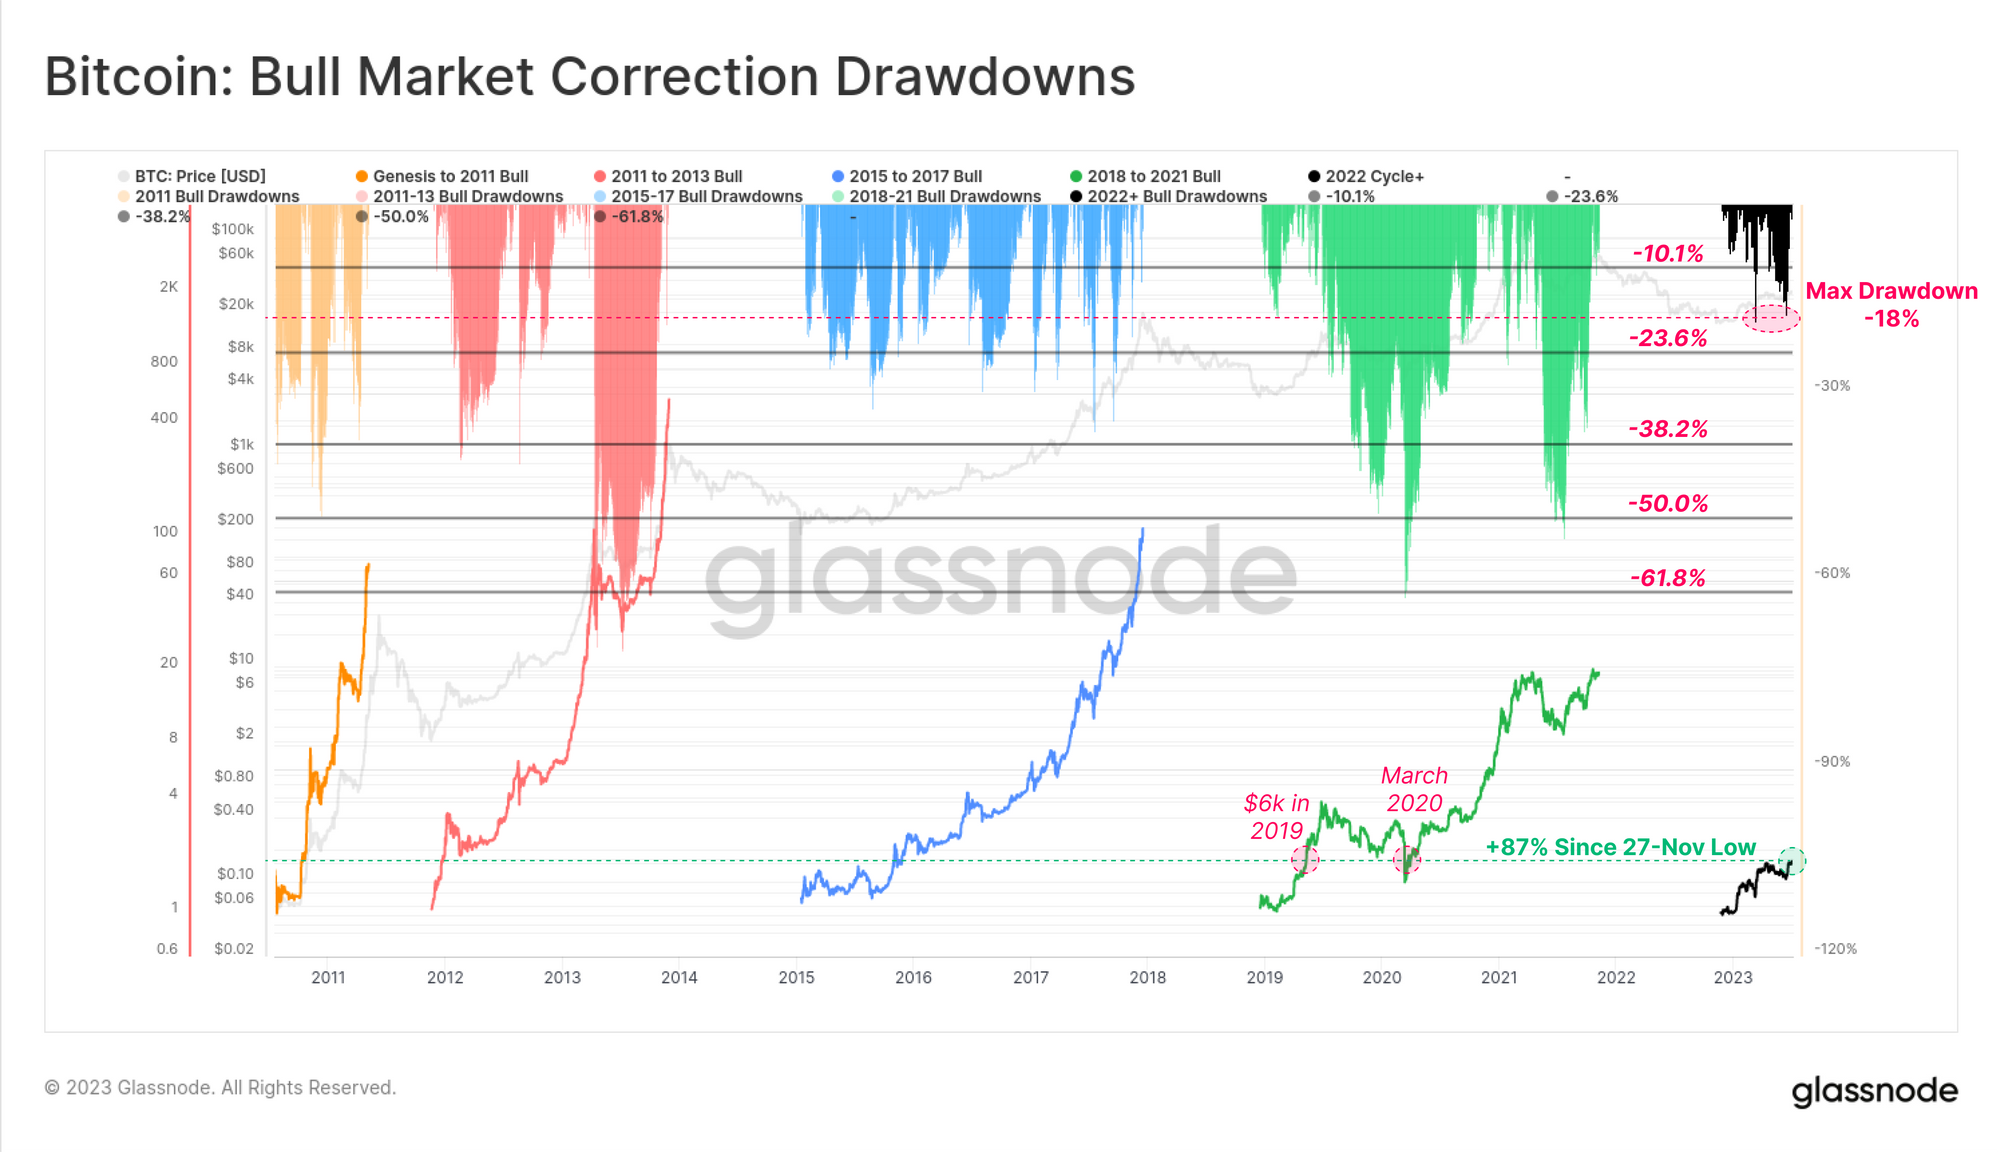
The drawdowns across the bull markets | Source: Glassnode's The Week Onchain - Week 28, 2023
As shown in the chart, the Bitcoin rally has seen a peak drop of only 18% so far, which is clearly much less than what previous bull markets saw. “This may suggest that there is relatively strong demand underlying the asset,” suggests Glassnode.
BTC price
At the time of writing, Bitcoin is trading around $30,400, down 2% over the past week.
BTC has continued its sideways movement recently | Source: BTCUSD on TradingView
Featured image from iStock.com, charts from TradingView.com, Glassnode.com