

Bitcoin price started a strong rise above USD 68,500. BTC even tested $70,000, but after the Fed there was a major bearish reaction.
- Bitcoin started to decline again from the $70,000 resistance zone.
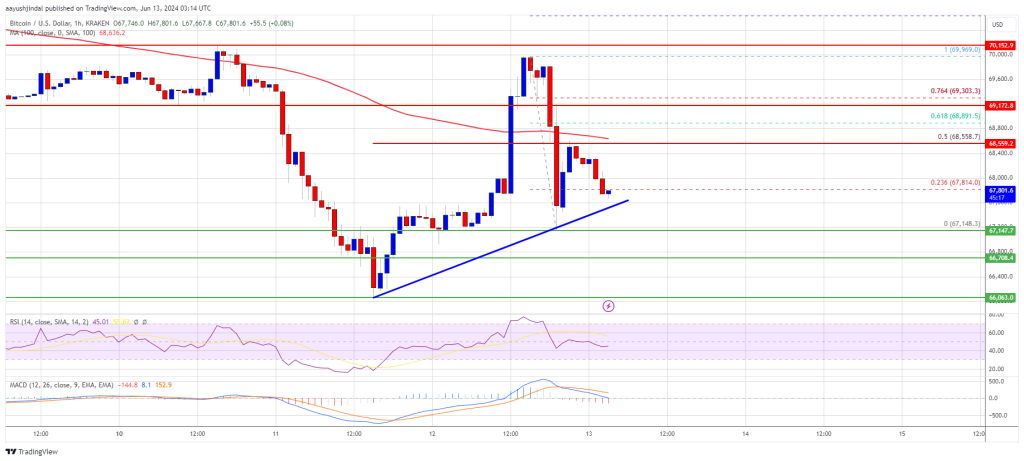
- The price is trading below $68,550 and the 100 hourly Simple Moving Average.
- A connecting bullish trendline is forming with support at $67,500 on the hourly chart of the BTC/USD pair (data feed from Kraken).
- The pair could recover, but upside could be limited above the $68,550 level.
Bitcoin price drops again
Bitcoin price started a steady rise above the USD 68,500 resistance zone. BTC has even crossed the USD 69,200 resistance zone. However, after the Fed kept rates at 5.5%, there was a strong bearish reaction.
The price fell below the USD 68,800 and USD 68,500 levels. The price tested the $67,200 zone. A low was formed at $67,148 and the price is now consolidating losses near the 23.6% Fib retracement level of the downward move from the $69,969 swing high to the $67,148 low.
Bitcoin is now trading below $68,800 and the 100 hourly Simple Moving Average. A connecting bullish trendline is also forming with support at $67,500 on the hourly chart of the BTC/USD pair. On the upside, the price is facing resistance around the $68,250 level. The first major resistance could be at $68,550 and the 50% Fib retracement level of the downside move from the $69,969 swing high to the $67,148 low.
The next major resistance could be $69,200. A clear move above the USD 69,200 resistance could push the price higher. In the mentioned case, the price could rise and test the USD 70,000 resistance. Any further gains could send BTC towards the USD 71,200 resistance in the short term.
Lose more in BTC?
If Bitcoin fails to climb above the USD 68,550 resistance zone, it could trigger another decline. The immediate downside support is near the $67,200 level.
The first major support is $67,000. The next support is now near $66,000. Any further losses could send the price towards the $65,500 support zone in the near term.
Technical indicators:
Hourly MACD – The MACD is now losing pace in the bearish zone.
Hourly RSI (Relative Strength Index) – The RSI for BTC/USD is now below the 50 level.
Major support levels – USD 67,000, followed by USD 66,000.
Major resistance levels – $68,550 and $69,200.