

Bitcoin has fallen below $70,000 again selling pressure continues to dominate among crypto traders. Notably, there is currently little sign of strong buying demand that could halt a further downward trend, and the current structure remains in place room for a Bitcoin price drop under $60,000.
Interestingly, technical analysis shows that Bitcoin’s price action is happening is starting to look like the pattern it emerged during the 2022 bear market, with long-term data showing that Bitcoin’s bear cycles have gradually become less severe over time.
Related reading
Bitcoin’s bear market cycles are shrinking
Technical analysis of The complete price history of Bitcoin shows that the post-cycle drawdowns are compressed with almost mechanical precision. This pattern hidden in plain sight was outlined by crypto analyst CrypFlow on social media platform X.
According to the analyst, each major bear market has produced a smaller percentage decline than the last, starting with a 93% collapse after the 2011 peak. The 2013 peak was followed by an 87% collapse. After the 2017 run, the market returned 84%. Finally, as the 2021 bull cycle peaked, the ensuing bear market stalled with a relatively modest 78% decline.
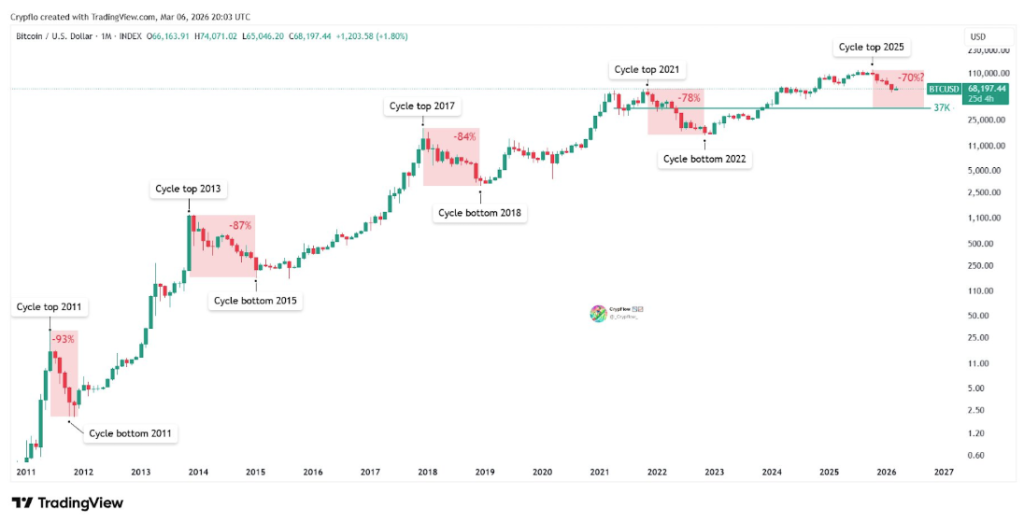
The argument is that Bitcoin’s growth into a deeper, more liquid market has gradually reduced the kind of downside volatility that defined the early years. Based on that context, the next big bear market low shouldn’t have to rival the bloodshed of previous cycles. Therefore, it is safe to assume a worst-case scenario of a 70% drop from Bitcoin’s 2025 peak price of $126,080.
If we extrapolate that compression forward, a 70% crash the 2025 cycle top would put Bitcoin somewhere around $37,000. However, the analyst also noted that this price is not a bottom prediction. It is also worth noting that Bitcoin has never closed a monthly candle below the previous cycle top during a bear market. In this case, that previous cycle top is the 2021 peak around $69,000.
Famous Bull Trap from 2022 and possible drop to $50,000
Bitcoin’s bear market cycles may be shrinking, but a look at the current price pattern shows that it may play out much like the 2022 bear market. This was revealed in a setup by a crypto analyst named Chiefy on X.
In that setup, Bitcoin’s current price action was placed side by side with the 2022 bear market, with both periods showing what was a textbook example of a bear trap followed by a bull trap.
In September 2022, Bitcoin staged what appeared to be a recovery at $18,000 after a brutal descent. However, this led to a bull trap around $21,000 that lured buyers in before the price action reversed and broke new lows.
Related reading
The script set in early 2026 is identical, according to this analysis. The bear trap in this case was Bitcoin’s fall to $60,000 in February, followed by a new bull trap as it rose to $74,000. If the 2022 analogy is correct, that rebound is not a recovery. It’s a setup, and the next lowest Bitcoin price, the analyst warns, is around $50,000.
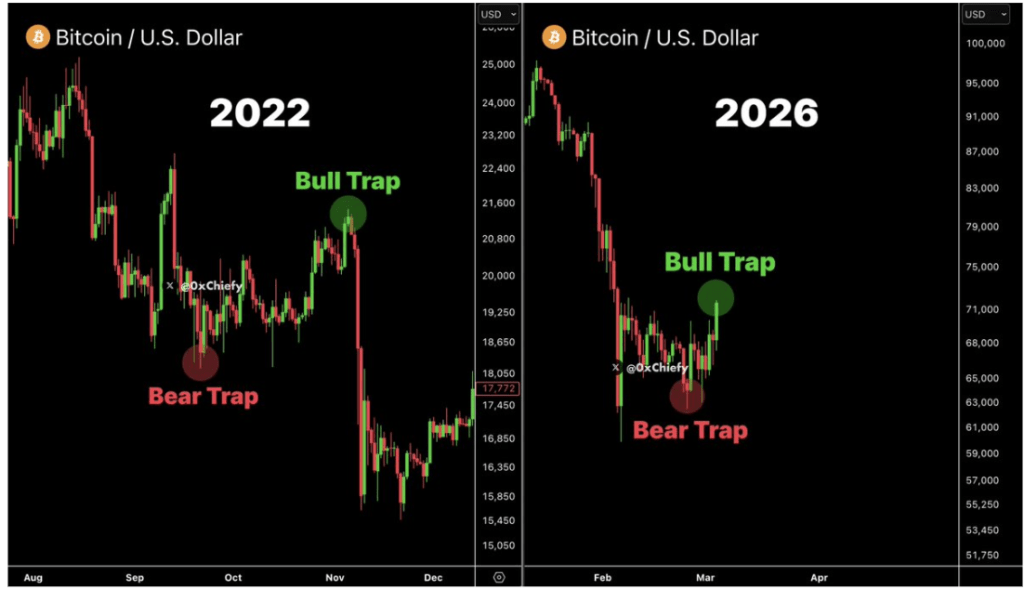
Bitcoin price chart. Source: @0xChiefy On X
Featured image from Unsplash, chart from TradingView