
 struggles with recovery, $165 level proves difficult to crack")
Solana started a new decline below the USD 165 pivot zone. SOL price is now trying to recover and is facing hurdles near the $165 zone.
- The SOL price started a new decline below USD 162 and USD 160 against the US dollar.
- The price is now trading below $162 and the 100-hour moving average.
- A new bearish trendline is forming with resistance at $159 on the hourly chart of the SOL/USD pair (Kraken data source).
- The price could continue to rise if $160 and $162 are cleared.
Solana Price faces hurdles
Solana price extended losses below $150 before the appearance of bulls such as Bitcoin and Ethereum. SOL tested the $145 zone and recently started a recovery wave.
There was a move above the USD 150 and USD 155 resistance levels. The price climbed above the 23.6% Fib retracement level of the downward move from the $188 swing high to the $145 low. However, the bears remained active near the $162-$165 resistance zone.
Furthermore, a new bearish trendline is forming with resistance at $159 on the hourly chart of the SOL/USD pair. Solana is now trading below $162 and the 100-hour moving average.
On the upside, immediate resistance is around the $160 level and trendline. The next major resistance is around the $162 level. The key resistance could be at USD 165. A successful close above the $165 resistance zone could set the pace for another steady rise.
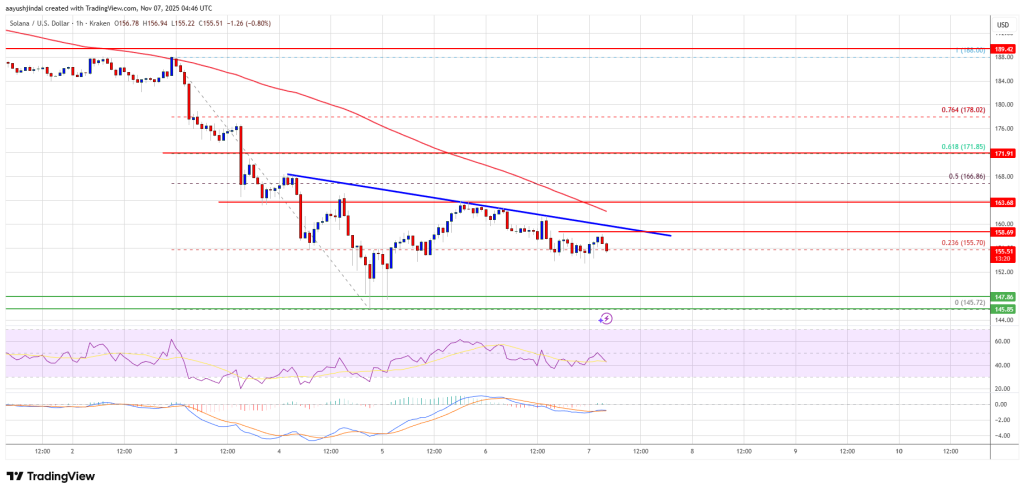
The next major resistance is $172 and the 61.8% Fib retracement level of the downward move from the $188 swing high to the $145 low. Any further gains could send the price towards the USD 180 level.
Another drop in the SOL?
If SOL fails to rise above the $160 resistance, the price may continue to decline. The initial downside support is near the $150 zone. The first major support is near the $145 level.
A break below the $145 level could send the price towards the $138 support zone. If there is a close below the $138 support, the price could fall towards the $130 zone in the near term.
Technical indicators
Hourly MACD – The MACD for SOL/USD is gaining speed in the bearish zone.
Hourly RSI (Relative Strength Index) – The RSI for SOL/USD is below the 50 level.
Major support levels – USD 150 and USD 145.
Major resistance levels – $160 and $165.