
 Recovery Efforts Increase, But Volume Still Indicates Caution")
Solana started a new decline below the $162 zone. SOL price is now trying to recover and is facing hurdles near the $166 zone.
- The SOL price started a new decline below USD 165 and USD 162 against the US dollar.
- The price is now trading below $165 and the 100-hour moving average.
- There was a break above a key bearish trendline with resistance at $155 on the hourly chart of the SOL/USD pair (Kraken data source).
- The price could continue to rise if $165 and $166 are cleared.
Solana Price attempts recovery surge
Solana price failed to hold steady above $175 and started a new decline, just like Bitcoin and Ethereum. SOL fell below the USD 170 and USD 165 support levels.
The price gained bearish momentum below $160. A low was formed at $145, and the price recently started a recovery wave. There was a move above the 23.6% Fib retracement level of the downward move from the $188 swing high to the $145 low.
Additionally, there was a break above a key bearish trendline with resistance at $155 on the hourly chart of the SOL/USD pair. Solana is now trading below $165 and the 100-hour moving average.
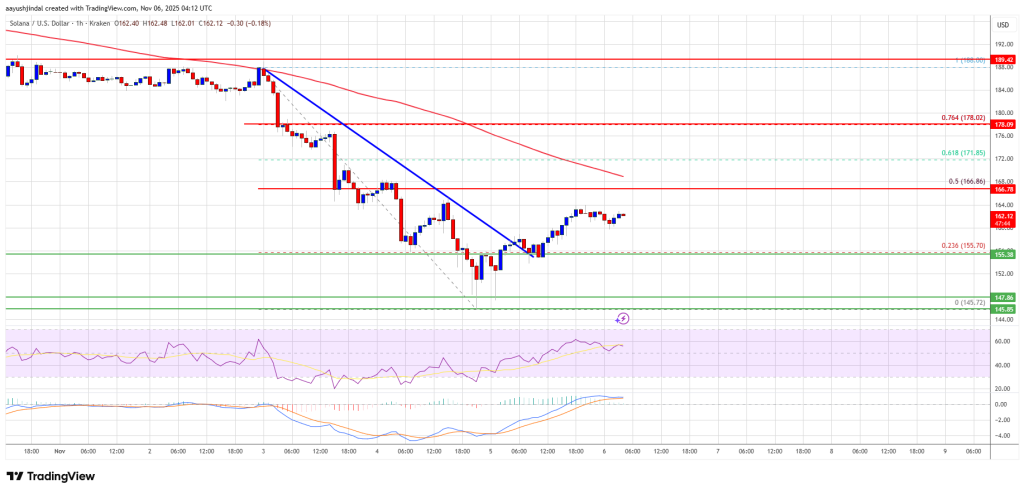
On the upside, immediate resistance is around the $165 level. The next major resistance is near the $166 level and the 50% Fib retracement level of the downward move from the $188 swing high to the $145 low. The key resistance could be at $172. A successful close above the $172 resistance zone could set the pace for another steady rise. The next major resistance is $180. Any further gains could send the price towards the USD 188 level.
Another drop in the SOL?
If SOL fails to rise above the USD 166 resistance, the price could continue to decline. The initial downside support is near the $160 zone. The first major support is near the $155 level.
A break below the $155 level could send the price towards the $148 support zone. If there is a close below the $148 support, the price could fall towards the $142 zone in the near term.
Technical indicators
Hourly MACD – The MACD for SOL/USD is losing pace in the bearish zone.
Hourly RSI (Relative Strength Index) – The RSI for SOL/USD is above the 50 level.
Major support levels – USD 155 and USD 148.
Major resistance levels – $165 and $166.