
 Plunges – Sellers Tighten Their Grip, Recovery Efforts Fail")
Solana started a new decline from the $188 zone. SOL price is now consolidating losses below USD 180 and could decline further below USD 175.
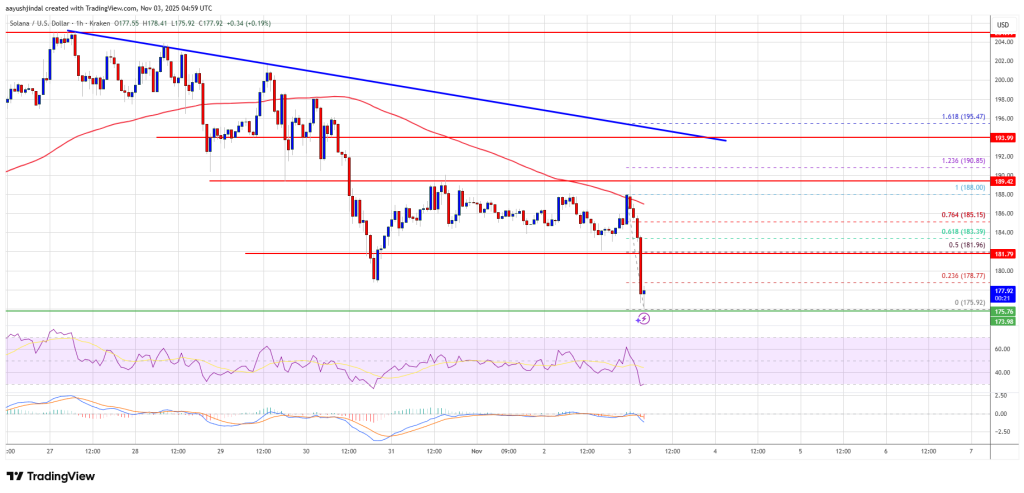
- The SOL price started a new decline below USD 185 and USD 180 against the US dollar.
- The price is now trading below $182 and the 100-hour moving average.
- A major bearish trendline is forming with resistance at $192 on the hourly chart of the SOL/USD pair (Kraken data source).
- The price could rise again if the bulls defend $175 or $172.
Solana price drops again
Solana’s price extended gains above USD 180 and USD 182, like Bitcoin and Ethereum. SOL even surpassed $188 before the bears showed up. A high was formed around $189 and the price fell.
There was a move below USD 185 and USD 180. A low was formed at $176, and the price is now consolidating losses with a bearish angle below the 23.6% Fib retracement level of the downward move from the $188 swing high to the $176 low. Moreover, a major bearish trendline is forming with resistance at $192 on the hourly chart of the SOL/USD pair.
Solana is now trading below $185 and the 100-hour moving average. On the upside, immediate resistance is near the $182 level or the 50% Fib retracement level of the downward move from the $188 swing high to the $176 low.
The next major resistance is around the $185 level. The main resistance could be at USD 188. A successful close above the $188 resistance zone could set the pace for another steady rise. The next major resistance is $192 and the trendline. Any further gains could send the price towards the USD 200 level.
Disadvantage of continuation in SOL?
If SOL fails to rise above the USD 188 resistance, the price could continue to decline. The initial downside support is near the $175 zone. The first major support is near the $172 level.
A break below the $172 level could send the price towards the $165 support zone. If there is a close below the $165 support, the price could fall towards the $150 support in the near term.
Technical indicators
Hourly MACD – The MACD for SOL/USD is gaining speed in the bearish zone.
Hourly RSI (Relative Strength Index) – The RSI for SOL/USD is below the 50 level.
Major support levels – USD 175 and USD 172.
Major resistance levels – $188 and $192.