
 falls again – is this dip worth buying for a recovery?")
Solana started a new decline from the $238 zone. SOL price is now consolidating losses below USD 225 and could decline further below USD 218.
- The SOL price started a new decline below $232 and $230 against the US dollar.
- The price is now trading below $225 and the 100-hour moving average.
- There was a break below a key bullish trendline with support at $230 on the hourly chart of the SOL/USD pair (Kraken data source).
- The price could rise again if the bulls defend $218 or $212.
Solana price falls below support
Solana price extended gains above USD 225 and USD 230 like Bitcoin and Ethereum. SOL even surpassed $235 before the bears showed up. A high was formed around $238 and the price fell.
There was a move below $232. Moreover, there was a break below a key bullish trendline with support at $230 on the hourly chart of the SOL/USD pair. The pair traded as low as $217.47 and is currently consolidating losses below the 23.6% Fib retracement level from the recent decline from the $237 swing high to the $217 low.
Solana is now trading below $225 and the 100-hour moving average. If a recovery wave comes, the price may encounter resistance near the USD 222 level. The next major resistance is near the $228 level or the 50% Fib retracement level of the recent decline from the $237 swing high to the $217 low.
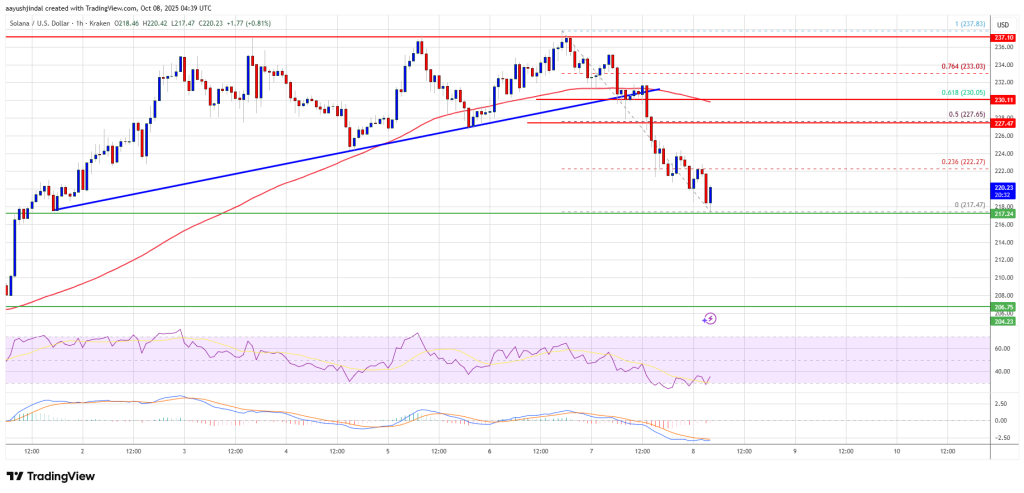
The main resistance could be at USD 230. A successful close above the $230 resistance zone could set the pace for another steady rise. The next major resistance is $238. Any further gains could send the price towards the USD 245 level.
Another drop in SOL?
If SOL fails to rise above the $230 resistance, it could continue to decline. The initial downside support is near the $218 zone. The first major support is near the $212 level.
A break below the $212 level could send the price towards the $200 support zone. If there is a close below the $200 support, the price could fall towards the $188 support in the near term.
Technical indicators
Hourly MACD – The MACD for SOL/USD is gaining speed in the bearish zone.
Hourly RSI (Relative Strength Index) – The RSI for SOL/USD is below the 50 level.
Major support levels – USD 218 and USD 212.
Major resistance levels – $230 and $238.