

Solana is gaining bearish momentum below $20 against the US dollar. The SOL price is struggling and could fall further towards $16.50 or even $15.00.
- SOL price is showing bearish signs below $20.00 and $20.50 against the US dollar.
- The price is now trading below $20 and the 100 simple moving average (4 hours).
- A major bearish trendline is forming with resistance near $19.20 on the 4-hour chart of the SOL/USD pair (Kraken data source).
- The pair could continue to decline if a close occurs below the $17.80 support.
Solana price drops further
In recent days, Solana price has made a number of attempts to break the USD 22.00 resistance. However, SOL failed to gain strength for a move above the $22.00 level.
As a result, there was a new bearish reaction below the support of USD 21.20, such as Bitcoin and Ethereum. More importantly, FTX’s news of a possible SOL sale is also putting a lot of pressure on the bulls. The price gained bearish momentum and traded below the USD 20.00 support.
Ultimately, it found support near $17.80. A low is formed near USD 17.78 and the price is now consolidating losses. SOL is now trading below $20 and the 100 simple moving average (4 hours).
Additionally, a major bearish trendline is forming with resistance around $19.20 on the 4-hour chart of the SOL/USD pair. On the upside, immediate resistance is near the $18.50 level or the 23.6% Fib retracement level of the downward move from the $20.59 swing high to the $17.78 low.
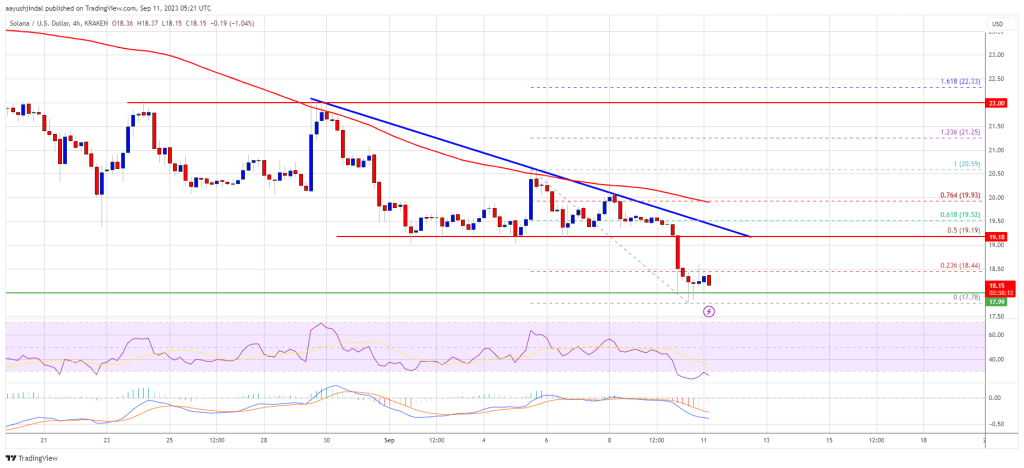
Source: SOLUSD on TradingView.com
The first major resistance is near the $19.20 level or trendline. The next major resistance is near the 76.4% Fib retracement level of the downward move from the $20.59 swing high to the $17.78 low at $20.00. A clear move above the USD 20.00 resistance could send the price towards the USD 21.20 resistance. Any further gains could send the price towards the USD 22 level.
Lose more in SOL?
If SOL fails to clear the USD 19.20 resistance, the price could continue to decline. The initial downside support is near the $17.80 level.
The first major support is near the $17.20 level. If there is a close below the USD 17.20 support, the price could fall towards the USD 16.50 support. In the mentioned case, there is a risk that more downsides will occur towards the $15.00 support in the short term.
Technical indicators
4-hour MACD – The MACD for SOL/USD is gaining speed in the bearish zone.
4-hour RSI (Relative Strength Index) – The RSI for SOL/USD is below the 50 level.
Major support levels – USD 17.80 and USD 17.20.
Major resistance levels – $19.20, $20.00 and $22.00.