

- Solana’s bullish rise is meeting resistance, with potential for new highs but risk of a pullback.
- SOL’s technical indicators show cautious optimism, but overcoming the resistance at $160 is crucial.
Solana [SOL] has staged a recovery in the past 24 hours, outpacing many of its crypto peers. However, analysts urge caution and suggest that the recent bullish wave could be a potential bull trap.
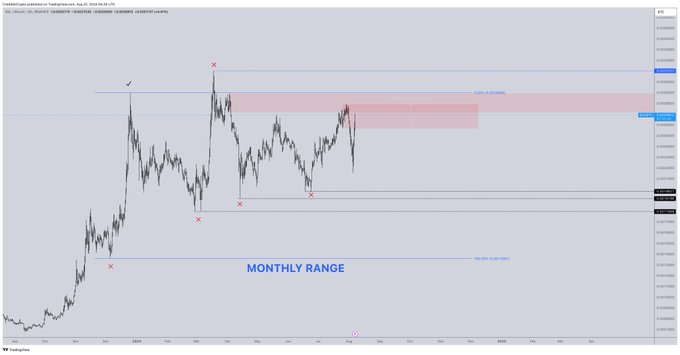
Crypto analyst CrediBULL Crypto has expressed concern over Solana’s current bullish trend against Bitcoin [BTC].
CrediBULL commented on X (formerly Twitter), which states:
“If we can get past this cluster of resistance, new local highs will follow. That said, I think all those built-up lows among us will eventually be wiped away, so don’t get euphoric as we take the highs here.
This suggests that while an outbreak may occur, there is a risk of a subsequent relapse, leading to a possible fake-out.
Source:
Solana’s market performance and technical indicators
At the time of writing, Solana’s price was $151.34, marking an increase of 7.32% in the last 24 hours. Despite this increase, SOL has seen a decline of 16.98% over the past week.
The price recently recovered from a low of around $120 and is approaching the midline of the Bollinger Bands, which are set at around $200 and $133, indicating potential volatility.
At this time of publication, the Relative Strength Index (RSI) stands at 46.90, indicating that SOL is neither overbought nor oversold. This level signals the possibility of further upside momentum as buying pressure increases.
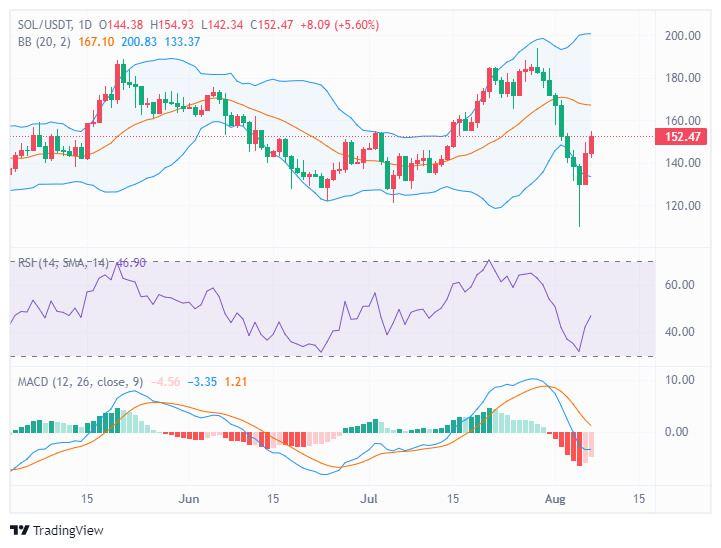
Source: TradingView
Additionally, the MACD histogram remains negative but shows signs of narrowing, with a potential bullish crossover if positive momentum continues.
These technical indicators point to a cautious but possibly bullish outlook for SOL, contingent on overcoming resistance levels around $160.
Meanwhile, the possibility of Solana-based Exchange Traded Funds (ETFs) has become a topic of heated debate.
VanEck’s Head of Digital Assets Research Mathew Sigel has taken a bullish stance. suggestive that Solana ETFs could materialize sooner than expected.
This optimistic view contrasts with the conservative approach of industry giant BlackRock, which currently considers such a development premature.
Market activity and user engagement
According to DefiLlamaSolana’s active addresses reached 1.04 million in the last 24 hours, with 32.55 million transactions recorded.
The Total Value Locked (TVL) in Solana’s ecosystem stands at $4.808 billion, showing an increase of 8.61% from the last day. This indicates growing user involvement and increasing network usage.
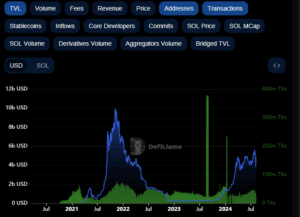
Source: DefiLlama
Despite fluctuations, the overall trend in active addresses appears to be consistently upward. The TVL trend has undergone notable changes, with peaks in late 2021 and a sharp increase in 2024, highlighting the dynamic nature of the ecosystem.
Realistic or not, here is SOL’s market cap in terms of BTC
According to a recent AMBCrypto reportSolana is perhaps the golden goose of the best cryptocurrencies in terms of market capitalization. The rapid rise since October last year attracted many investors and traders.
Every dip that has occurred since then has been followed by a rapid recovery.