

Bitcoin price started to rise sharply and broke the USD 62,000 resistance level. BTC is showing positive signs and could rise towards the USD 63,200 level.
- Bitcoin gained bullish momentum above the USD 60,500 resistance zone.
- The price is trading above USD 61,500 and the 100 hourly Simple Moving Average.
- A major bullish trendline is forming with support at $61,000 on the hourly chart of the BTC/USD pair (data feed from Kraken).
- The pair could continue to rise if it breaks the $62,500 support.
Bitcoin price regains strength
Bitcoin price started a decent rise above the USD 59,500 and USD 60,000 resistance levels. BTC even managed to overcome the USD 60,500 resistance to move into a positive zone. It caused a sharp increase and the price climbed above the USD 62,000 level.
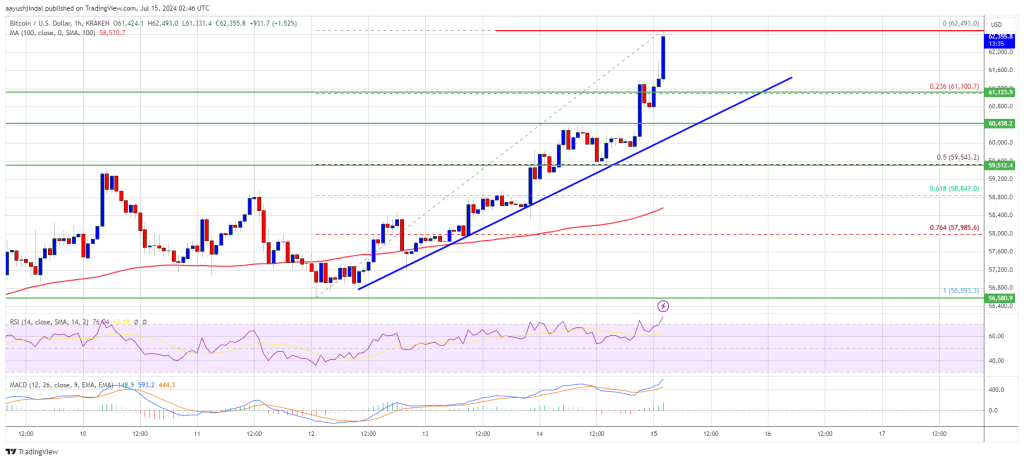
It even tested the USD 62,500 level. It reached a high at $62,493 and the price is now consolidating gains. It is trading well above the 23.6% Fib retracement level of the upward move from the $56,593 swing low to the $62,493 high.
Bitcoin price is now trading above $61,500 and the 100 hourly Simple Moving Average. A major bullish trendline is also forming with support at $61,000 on the hourly chart of the BTC/USD pair.
The immediate resistance on the upside is near the $62,500 level. The first major resistance is near the $62,800 level. A clear move above the USD 62,800 resistance could trigger a decent upside in the coming sessions. The next major resistance could be at USD 63,200.
The next big hurdle is at $63,500. A close above the resistance at $63,500 could trigger a steady rise and send the price higher. In the mentioned case, the price could rise and test the USD 65,000 resistance.
Are dips supported in BTC?
If Bitcoin fails to climb above the USD 62,500 resistance zone, a downward correction could occur. The immediate downside support is near the USD 61,500 level.
The first major support is $61,000 and the trendline zone. The next support is now near $60,000. Any further losses could send the price towards the $59,500 support zone in the near term.
Technical indicators:
Hourly MACD – The MACD is now gaining speed in the bullish zone.
Hourly RSI (Relative Strength Index) – The RSI for BTC/USD is now above the 50 level.
Major support levels – USD 61,500, followed by USD 61,000.
Major resistance levels – $62,500 and $63,500.